
Research article · 2018 · Full text
International Journal of Statistics and Applied MathematicsA study on casing damage based on effect of water injection pressure
Volume 3(1) · Pages 01–03
Research areasDrilling and Well EngineeringOil and Gas Production TechniquesHydraulic Fracturing and Reservoir Analysis
Abstract
Author-writtenThe water flooding extraction of the oilfield, the quantity and increasing speed of oilfield casing damage are rising obviously. Casing damage creates the loss of economy and also affect the development of the oilfield. The problem of casing damage has become an urgent problem an the oilfield. This paper gives a study of casing damage based on effect of water injection pressure in a particular oil field and the datas are analysed and the results are tabulated. Mechanism of casing damage is discontinuous deformation in the overloading strata and the discontinuous deformation includes interlayer sliding and fault movement induced by subsidence, which results in casing shear damage. The oil pressure goes down axial compression and bending of casing are caused by large vertical displacement. The casing damage in the middle of production floor is because of the largest axial strain and casing bent because of excessive axial load and its surroundings without sufficient lateral support. Channeling is easily caused when water injection pressure fracture pressure in the case of poor cementing quality. In the case of water channel, immersion area forms and strata stress is out of balance, which results in that the casing damage area from in large immersion area. However, there is no effective way to prevent and slow the damage of casing well. Example as pubei oilfield in china “Casing damage on effect of water injection pressure” The distribution of casing damage is raised and the effect rule and mechanism that water injection pressure acts on casing damage of injection wells and oil wells are studied.
Summary
Source-checkedPlain-language reading of the full paper, prepared with AI and checked against the text. Each point links to the authors' own words.
Why it matters
- Casing damage is becoming an urgent problem in oilfields using water flooding extraction because it increases economic losses and hinders oilfield development. View evidence ↗
- Casing shear damage is caused by discontinuous deformation in overloading strata, specifically through fault movement and interlayer sliding triggered by subsidence. View evidence ↗
- Poor cementing quality can lead to channeling when water injection pressure exceeds fracture pressure, causing imbalanced strata stress and expanding the area of casing damage. View evidence ↗
The question
- The study aims to investigate the distribution of casing damage and the mechanisms by which water injection pressure affects both injection and oil wells. View evidence ↗
What they did
- The research focuses on the Pubei oilfield in China as a case study. View evidence ↗
- The study analyzed 355 casing-damaged wells in the seventh oil production plant of Daqing oilfield, consisting of 247 injection wells and 108 oil wells. View evidence ↗
- Mathematical statistics, specifically linear and polynomial regression methods, were used to analyze the relationship between well array numbers, casing damage rates, and oil pressure. View evidence ↗
What they found
- Injection wells are significantly more prone to damage, accounting for 80.28% of all casing-damaged wells. View evidence ↗
- The second and third blocks are the most affected areas in the Pubei oilfield, containing 163 damaged wells, or 64.68% of the total. View evidence ↗
- In the second block, the casing damage rate increases from north to south, peaking at the 79th row of wells before decreasing. View evidence ↗
- In the third block, casing damage increases linearly from north to south, reaching a maximum rate of 15% in the 90th row of wells. View evidence ↗
- Comparative analysis indicates that casing damage is significantly more severe in the second block than in the third block. View evidence ↗
- In the second block, oil pressure in water injection wells increases linearly from north to south, mirroring the trend of the casing damage rate. View evidence ↗
- Similarly, in the third block, oil pressure increases linearly from north to south, which is consistent with the observed casing damage rate. View evidence ↗
What it means
- The authors conclude that casing damage in oil and water wells is directly related to the water injection processes of the oilfield. View evidence ↗
- The study successfully characterized the general situation and distribution of casing damage and established the relationship between water injection pressure and damage in oil wells. View evidence ↗
Visual summary
3 visualsIllustrations explain the paper; charts are replotted from the paper's own table values.
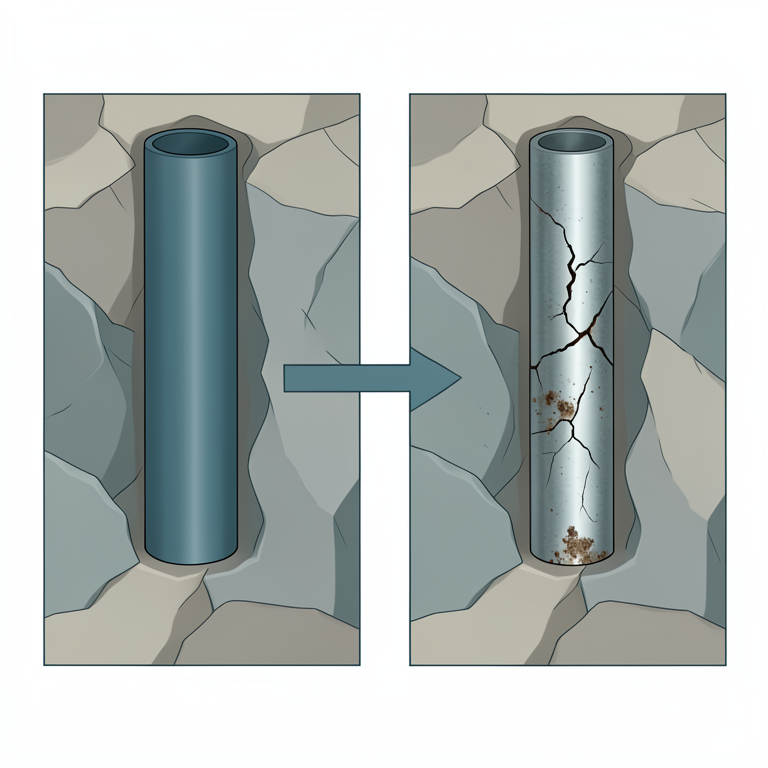
Correlation between Pressure and Damage
AI-generated conceptual illustration (steel oil well casing pipes in underground rock strata). It explains the idea and does not show study data.
View source evidence ↗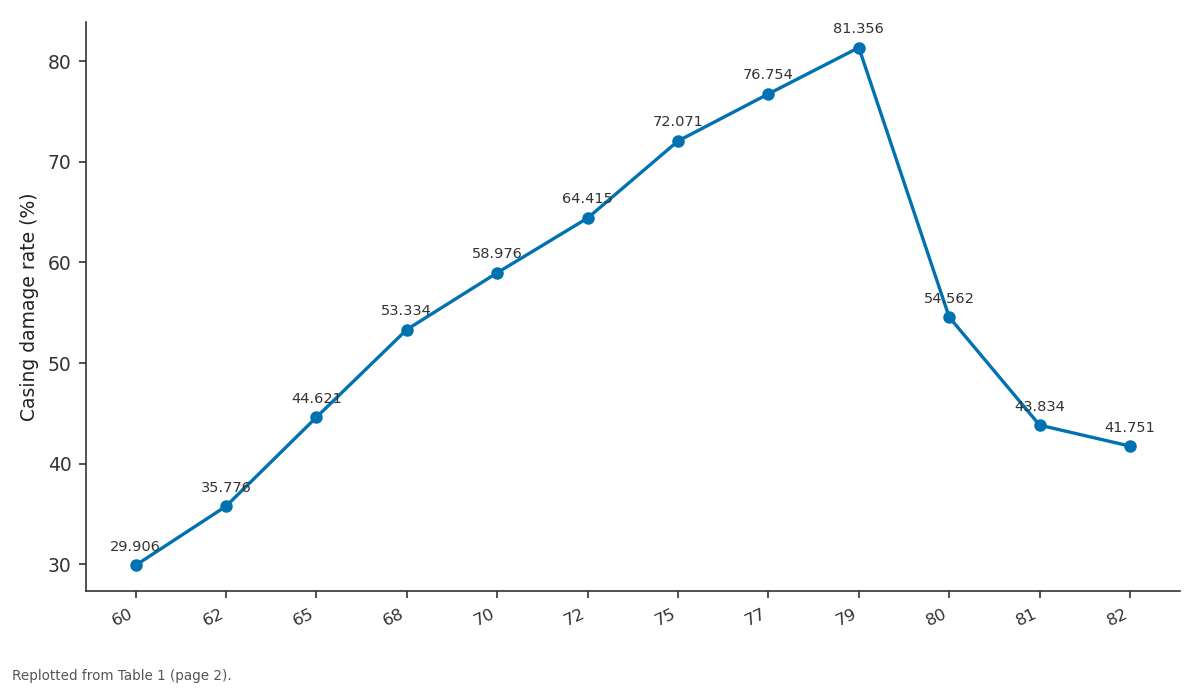
Casing damage rate (%): 60 vs 62 vs 65 vs 68 vs 70
Replotted from Table 1 (page 2) of the original paper. Every bar is the paper's own table value.
View source evidence ↗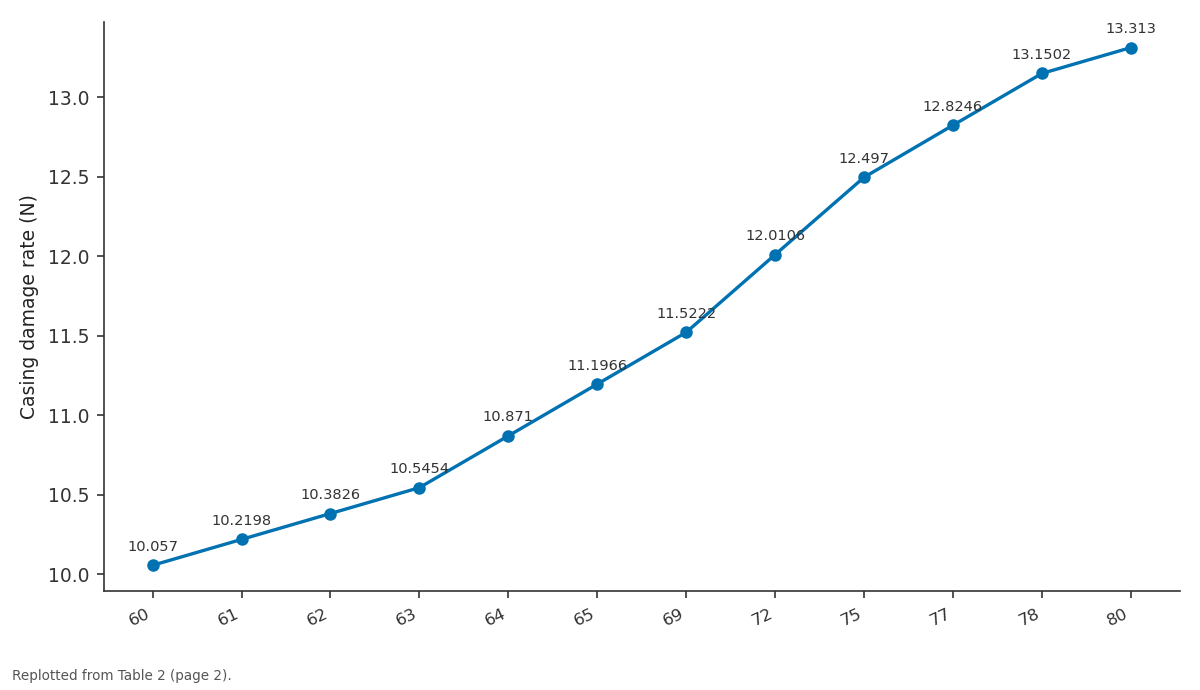
Casing damage rate (N): 60 vs 61 vs 62 vs 63 vs 64
Replotted from Table 2 (page 2) of the original paper. Every bar is the paper's own table value.
View source evidence ↗Figures & tables
From the original paper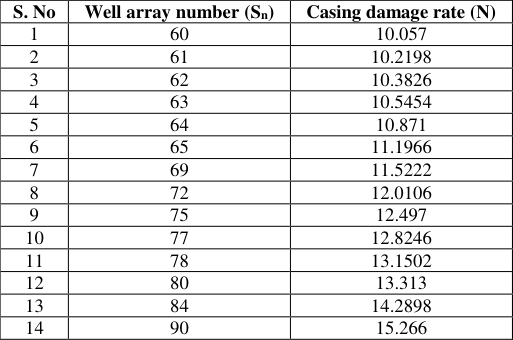 Table 2
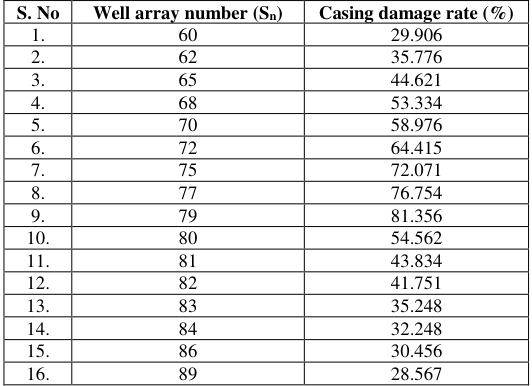 Table 1
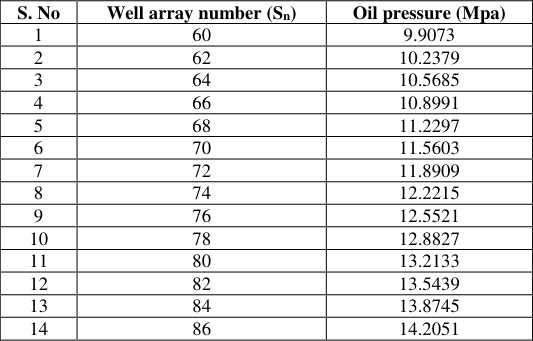 Table 3
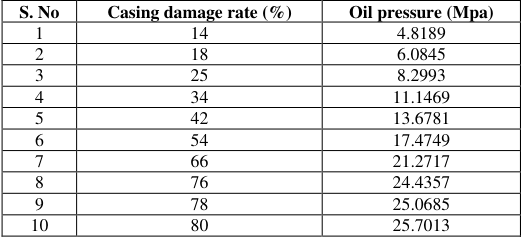 Table 5
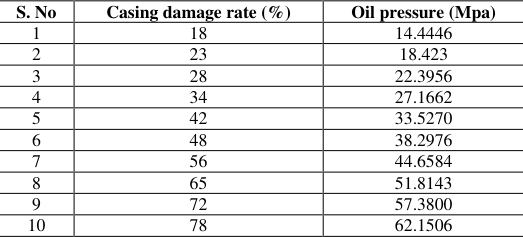 Table 6
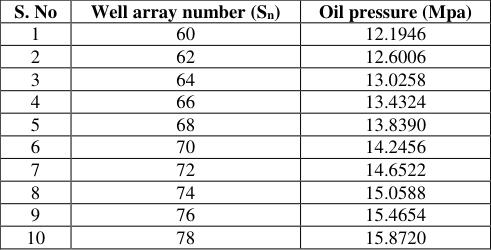 Table 4
Results
in casing shear damage. The oil pressure goes down axial compression and bending of casing are caused by large vertical displacement. The casing damage in the middle of production floor is because of the largest axial strain and casing bent because of excessive axial load and its surroundings without sufficient lateral support. Channeling is easily caused when water injection pressure fracture pressure in the case of poor cementing quality.
In the case of water channel, immersion area forms and strata stress is out of balance, which
Results
in that the casing damage area from in large immersion area. However, there is no effective way to prevent and slow the damage of casing well. Example as pubei oilfield in china “Casing damage on effect of water injection pressure” The distribution of casing damage is raised and the effect rule and mechanism that water injection pressure acts on casing damage of injection wells and oil wells are studied. Keywords: Casing damage, water injection pressure, flooding extraction
Introduction
General Situation and Distribution of Casing Damage in Pubei Oilfield General situation of casing damage The number of casing damaged wells in the seventh oil production plant of daqing oilfield is 355, among which 247 are injection wells, and 108 are oil wells. Casing damaged injection wells accounts for 80.28% of the total casing damaged wells. There are 285 casing damaged wells in the pubei oilfield, which accounts for 80.28% of the total number of the seventh oil production plant of daqing oilfield. The main forms of casing damage are deformation and dislocation.168 wells emerge casing dislocation and deformation appear in 153wells.
Casing damaged wells two kinds of forms account for 90.42% of the total casing damaged wells. In vertical casing damage mainly emerge in reservoirs. The second and third blocks are main casing damage blocks in Pubei oilfield, and the number of casing damaged wells is 163, which accounts for 64.68% of total casing damaged wells in pubei oilfield. Casing damaged wells account for 19.52% of the oil and water wells in the second block.
Casing damaged wells account for 16.23% of the oil and water wells in the third block. Distribution of casing damage Analyze the distribution statistical data of casing damaged wells along north and south direction in the second block with regression method to obtain the curve and mathematical relation of casing damage rate. Maths 2018; 3(1): 01-03 J Nirmala Assistant Professor, Department of Mathematics, KG College of Arts and Science, Coimbatore, Tamil Nadu, India Correspondence J Nirmala Assistant Professor, Department of Mathematics, KG College of Arts and Science, Coimbatore, Tamil Nadu, India Distribution of statistical data in second block Oil production in Water injection pressure (well array Casing damage rate (percentage pressure (Mpa) number) %) N ∑ xy − ∑x ∑y Here, Mathematical statistics method will be used to analyze the casing damage. By using linear regression method, N = a + b Sn Sn = well array number N = casing damage rate b = N ∑x2 – (∑x)2 8 (837.68)− (70.625)(13.81) b = 8(5018.625)−(70.625)2 = 0.16285 ∑y –b(∑x) a = 13.81− 0.1628(70.625) N a = 62 10.5 9.5 65 10 8.5 68 12 13.5 74 20 7.2 79 34 13.2 82 69 14.2 84 43 15.8 86 32 16 Here, Mathematical statistics method will be used to analyze the casing damage.By using polynomial regression method, N = a + bSn +cSn2 +dSn3 8 = 0.28903 N = a + bSn N = 0.2890 + 0.1628 Sn ………. (2) Table 2 N = 152.846- 11.337 Sn + 0.2268 Sn2 +0.0012Sn3 .............. (1) N = casing damage rate Sn = well array number Table 1 S.
| S. No | Well array number (Sn) | Casing damage rate (%) |
|---|---|---|
| 1. | 60 | 29.906 |
| 2. | 62 | 35.776 |
| 3. | 65 | 44.621 |
| 4. | 68 | 53.334 |
| 5. | 70 | 58.976 |
| 6. | 72 | 64.415 |
| 7. | 75 | 72.071 |
| 8. | 77 | 76.754 |
| 9. | 79 | 81.356 |
| 10. | 80 | 54.562 |
| 11. | 81 | 43.834 |
| 12. | 82 | 41.751 |
| 13. | 83 | 35.248 |
| 14. | 84 | 32.248 |
| 15. | 86 | 30.456 |
| 16. | 89 | 28.567 |
Table text extracted from the original PDF; superscript letters are shown inline. The original table image is below.
View original table image
| S. No | Well array number (Sn) | Casing damage rate (N) |
|---|---|---|
| 1 | 60 | 10.057 |
| 2 | 61 | 10.2198 |
| 3 | 62 | 10.3826 |
| 4 | 63 | 10.5454 |
| 5 | 64 | 10.871 |
| 6 | 65 | 11.1966 |
| 7 | 69 | 11.5222 |
| 8 | 72 | 12.0106 |
| 9 | 75 | 12.497 |
| 10 | 77 | 12.8246 |
| 11 | 78 | 13.1502 |
| 12 | 80 | 13.313 |
| 13 | 84 | 14.2898 |
| 14 | 90 | 15.266 |
Table text extracted from the original PDF; superscript letters are shown inline. The original table image is below.
View original table image
No Well array number (Sn) Casing damage rate (%) 1. 60 29.906 2. 62 35.776 3. 65 44.621 4. 68 53.334 5. 70 58.976 6. 72 64.415 7. 75 72.071 8. 77 76.754 9. 79 81.356 10. 80 54.562 11. 81 43.834 12. 82 41.751 13. 83 35.248 14. 84 32.248 15. 86 30.456 16. 89 28.567 Based on this tabulated values the figure 1 will be drawn. Figure1 shows that the rate of casing damage increases gradually from north to south and reaches a maximum in the 79th row wells after that rate of casing damage decreases gradually. Analyze the distribution statistical data of casing damaged wells along north to south direction in the third block with regression method to obtain the curve and mathematical relation of casing damage Distribution of statistical data in third block Casing damage rate Oil production in Water injection pressure (well array (percentage %) pressure (Mpa) number) N ∑ xy − ∑x ∑y S. No Well array number (Sn) Casing damage rate (N) 1 60 10.057 2 61 10.2198 3 62 10.3826 4 63 10.5454 5 64 10.871 6 65 11.1966 7 69 11.5222 8 72 12.0106 9 75 12.497 10 77 12.8246 11 78 13.1502 12 80 13.313 13 84 14.2898 14 90 15.266 Based on this tabulated values the figure2 will be drawn.
Figure2 shows that the rate of casing damage increases linearly from north to south. The most serious casing damage is in the 90th row wells and the rate of casing damage is 15%. The comparison between figure1 and figure2, it shows that casing damage in the second block is much more serious than in the third block. Casing damage of oil water wells is directly related to water injection of oilfield.
Relationship between water injection pressure and casing damage of injection well Distribution of casing damage The oil pressure distribution of the second block 2007 and third block 2010 taken as examples, the relationship between oil pressure and well array of water injection wells is analyzed. Here, Mathematical statistics method will be used to analyze the casing damage. By using linear regression method, P = a + b Sn Sn = well array number P = oil pressure b = N ∑x2– (∑x)2 8 (941.48)−(75)(12.31) b = 8(5698.25)−(75)2 = 0.1653 62 11.5 7.8 65 19 12.5 67 21 10.5 68 11 13.2 73 8.4 12 75 14 13.5 77 12.4 12.5 78 13 14.2 ∑y –b(∑x) a = N (12.312)−0.1653(75) a = 8 = - 0.01068 P = a + bSn N = -0.01068 + 0.1653 Sn ………..….. (3) Table 3 Relationship between water injection pressure and casing damage in oil well Great diastrophism will be caused when water injection pressure is too high, resulting casing damage of oil wells around water injection wells. Through the field data, It shows that when mudstone layer is not hydrous, relative slipping layer is in the mudstone layer above water injection layer, but not in water injection layer.
| S. No | Well array number (Sn) | Oil pressure (Mpa) |
|---|---|---|
| 1 | 60 | 9.9073 |
| 2 | 62 | 10.2379 |
| 3 | 64 | 10.5685 |
| 4 | 66 | 10.8991 |
| 5 | 68 | 11.2297 |
| 6 | 70 | 11.5603 |
| 7 | 72 | 11.8909 |
| 8 | 74 | 12.2215 |
| 9 | 76 | 12.5521 |
| 10 | 78 | 12.8827 |
| 11 | 80 | 13.2133 |
| 12 | 82 | 13.5439 |
| 13 | 84 | 13.8745 |
| 14 | 86 | 14.2051 |
Table text extracted from the original PDF; superscript letters are shown inline. The original table image is below.
View original table image
The slipping occurs in the fault. Analyze the distribution statistical data of the second block with regression method to obtain the curve and mathematical relation of oil pressure P = 0.3893 + 0.3164 (N) ……………. (5) Table 5 S. No Casing damage rate (%) Oil pressure (Mpa) 1 14 4.8189 2 18 6.0845 3 25 8.2993 4 34 11.1469 5 42 13.6781 6 54 17.4749 7 66 21.2717 8 76 24.4357 9 78 25.0685 10 80 25.7013 Analyze the distribution statistical data of the third block with regression method to obtain the curve and mathematical relation of oil pressure, P = 0.13287 + 0.7951 (N) …………. (6) Table 6 N ∑ xy − ∑x ∑y S. No Well array number (Sn) Oil pressure (Mpa) 1 60 9.9073 2 62 10.2379 3 64 10.5685 4 66 10.8991 5 68 11.2297 6 70 11.5603 7 72 11.8909 8 74 12.2215 9 76 12.5521 10 78 12.8827 11 80 13.2133 12 82 13.5439 13 84 13.8745 14 86 14.2051 Figure 3 shows that the oil pressure of water injection wells in the second block increases linearly from north to south, which is basically consistent with the curve of casing damage rate.
| S. No | Casing damage rate (%) | Oil pressure (Mpa) |
|---|---|---|
| 1 | 18 | 14.4446 |
| 2 | 23 | 18.423 |
| 3 | 28 | 22.3956 |
| 4 | 34 | 27.1662 |
| 5 | 42 | 33.5270 |
| 6 | 48 | 38.2976 |
| 7 | 56 | 44.6584 |
| 8 | 65 | 51.8143 |
| 9 | 72 | 57.3800 |
| 10 | 78 | 62.1506 |
Table text extracted from the original PDF; superscript letters are shown inline. The original table image is below.
View original table image
| S. No | Casing damage rate (%) | Oil pressure (Mpa) |
|---|---|---|
| 1 | 14 | 4.8189 |
| 2 | 18 | 6.0845 |
| 3 | 25 | 8.2993 |
| 4 | 34 | 11.1469 |
| 5 | 42 | 13.6781 |
| 6 | 54 | 17.4749 |
| 7 | 66 | 21.2717 |
| 8 | 76 | 24.4357 |
| 9 | 78 | 25.0685 |
| 10 | 80 | 25.7013 |
Table text extracted from the original PDF; superscript letters are shown inline. The original table image is below.
View original table image
Oil pressure distribution of the third block 2010 Here, Mathematical statistics method will be used to analyze the casing damage. By using linear regression method, P = a + b Sn Sn = well array number P = oil pressure b = N ∑x2 – (∑x)2 8(1021.65)− (70.625)(14.475) b = 8(5018.25)−(70.625)2 = 0.2033 ∑y –b(∑x) a = N (14.475)−0.2033(70.625) a = 8 = 0.014625 P = a + bSn N = 0.014625 + 0.2033 Sn ……….. (4) Table 4 S. No Casing damage rate (%) Oil pressure (Mpa) 1 18 14.4446 2 23 18.423 3 28 22.3956 4 34 27.1662 5 42 33.5270 6 48 38.2976 7 56 44.6584 8 65 51.8143 9 72 57.3800 10 78 62.1506
| S. No | Well array number (Sn) | Oil pressure (Mpa) |
|---|---|---|
| 1 | 60 | 12.1946 |
| 2 | 62 | 12.6006 |
| 3 | 64 | 13.0258 |
| 4 | 66 | 13.4324 |
| 5 | 68 | 13.8390 |
| 6 | 70 | 14.2456 |
| 7 | 72 | 14.6522 |
| 8 | 74 | 15.0588 |
| 9 | 76 | 15.4654 |
| 10 | 78 | 15.8720 |
Table text extracted from the original PDF; superscript letters are shown inline. The original table image is below.
View original table image
Conclusion
Thus this paper gives a study of Casing damage based on effect of water injection pressure in one of the oil field. The relationship between water injection pressure and casing damage in oil well, distribution of casing damage and general situation of casing damage are generally discussed and the
Results
are tabulated and compared using statistical data.
References
4 in the original paper- Geomechanical Modeling of Reservoir Compaction, Surface Subsidence, and Casing Damage at the Belridge Diatomite Fredrich, JT, Terra Tek Inc. Evans, B., MIT.
- Model study on the kinetics of oil field formation damage due to salt precipitation from injectio Author links open overlay panel J. Moghadasiab H. Müller-Steinhagenc M. Jamialahmadia A. Sharifb
- Nirmala J. Structure of Liquid and Comparison of Adhesive Force with Cohesion Force. International Journal of Engineering, Science and Mathematics, 2017.
- Scale Formation in Iranian Oil Reservoir and Production S. No Well array number (Sn) Oil pressure (Mpa) 1 60 12.1946 2 62 12.6006 3 64 13.0258 4 66 13.4324 5 68 13.8390 6 70 14.2456 7 72 14.6522 8 74 15.0588 9 76 15.4654 10 78 15.8720 Figure 4 shows that the oil pressure of water injection wells in the third block increases linearly from north to south, which is basically consistent with the curve of casing damage rate. Equipment during Water Injection. J Moghadasi, University of Surrey.