
Research article · 2018 · Full text
International Journal of Veterinary Sciences and Animal HusbandryAdaptation of quality by design concept for the development & manufacturing of the new castle disease virus antibody detection test kit
Volume 3(5) · Pages 43–49
Research areasAnimal Disease Management and EpidemiologyVirus-based gene therapy researchAnimal Virus Infections Studies
Abstract
Author-writtenQbD (Quality by Design) is the recent systematic, scientific, risk-based, holistic, proactive approach & regulatory requirement for designing and developing the product and the manufacturing process to achieve the predefined product quality objectives and to reduce rejection or reprocessing of the batch, with increased cost and regulatory burden. New Castle Disease is one of the most common causing factors which can affect the high demand of the poultry eggs and meats. Although vaccines are commercially available to have protection against the New Castle Disease infection in poultry, there is need for the sero monitoring and quick detection of the developed antibody in the poultry. QbD concept is to be adopted for the development and manufacturing of the New Castle Disease (NDV) antibody detection test kit to have the detection kit with identified and required target profile. The results of the adaptation is to be evaluated on the products manufactured after the QbD concept is built into process of development and manufacturing of the NDV antibody detection.
Summary
Source-checkedPlain-language reading of the full paper, prepared with AI and checked against the text. Each point links to the authors' own words.
Why it matters
- New Castle Disease is a significant factor that negatively impacts the production and demand for poultry meat and eggs. View evidence ↗
- Despite the availability of commercial vaccines, there is a critical need for rapid detection and serological monitoring of antibodies in poultry. View evidence ↗
- Quality by Design (QbD) is a proactive, risk-based approach used to develop products and processes that meet predefined quality goals while reducing batch rejections. View evidence ↗
The question
- The study aims to apply the QbD concept to the development and manufacturing of a New Castle Disease (NDV) antibody detection kit to ensure it meets a specific target profile. View evidence ↗
What they did
- The NDV antigen was produced using the Lasota strain of the virus grown in chicken embryos. View evidence ↗
- The 96-well plates were coated with 100 µl of purified NDV antigen at a concentration of 3 µg/ml. View evidence ↗
What they found
- The developed kit showed a correlation with the reference of 0.99, exceeding the acceptance criterion of >0.90%. View evidence ↗
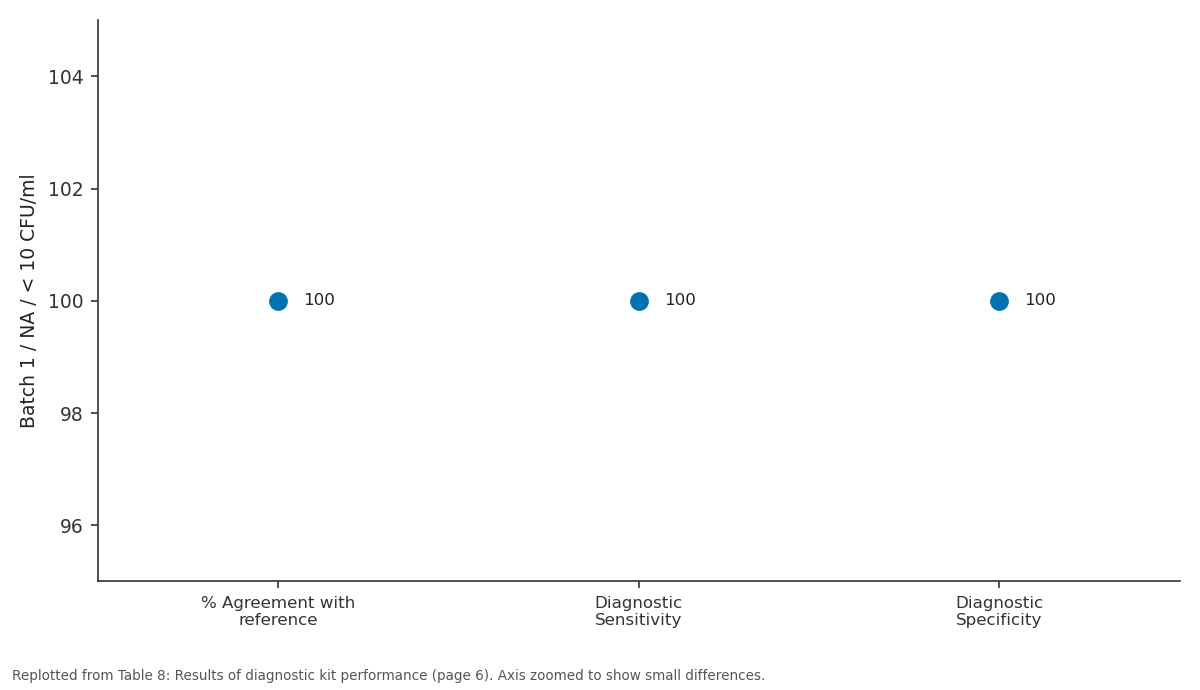
- The kit achieved 100% for agreement with reference, diagnostic sensitivity, and diagnostic specificity, all of which surpassed the >90% requirement. View evidence ↗
- The analytical sensitivity of the kit was 1/64,000, which is significantly better than the minimum requirement of >1/8,000. View evidence ↗
- The kit complied with analytical specificity requirements, showing a ratio >0.2 for NDV and <0.2 for other viruses including IBV, IBD, AI, and EDS. View evidence ↗
What it means
- The authors conclude that the developed NDV antibody detection kit successfully met all the predefined Quality Target Product Profiles (QTPP). View evidence ↗
Visual summary
1 visualsIllustrations explain the paper; charts are replotted from the paper's own table values.
Batch 1 / NA / < 10 CFU/ml: % Agreement with... vs Diagnostic Sensitivity vs Diagnostic Specificity
Replotted from Table 8 (page 6) of the original paper. Every bar is the paper's own table value.
View source evidence ↗Figures & tables
From the original paper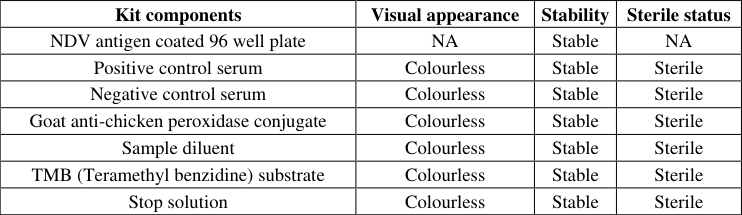 Table 1
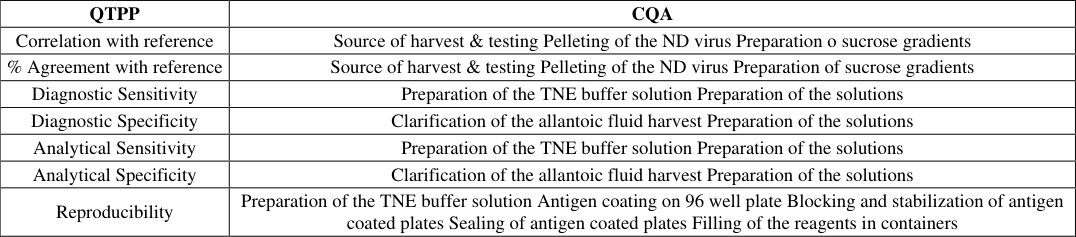 Table 2
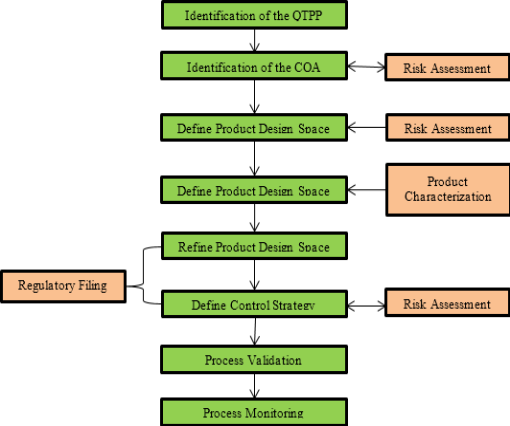 Figure 1
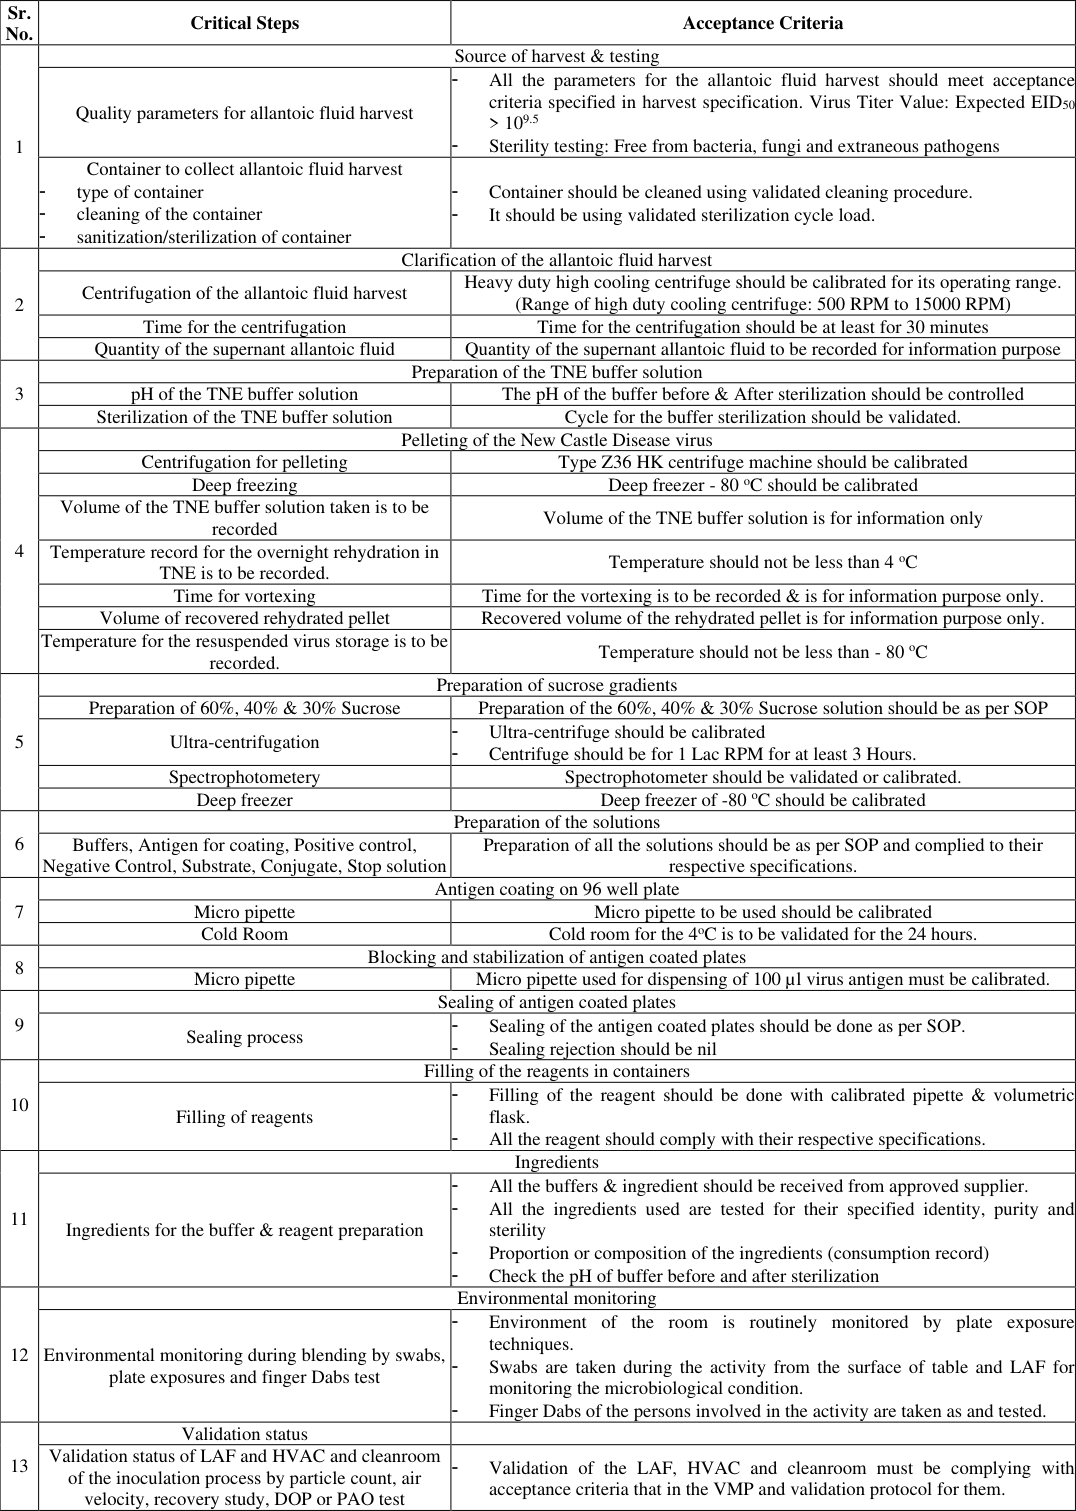 Table 3
 Table 4
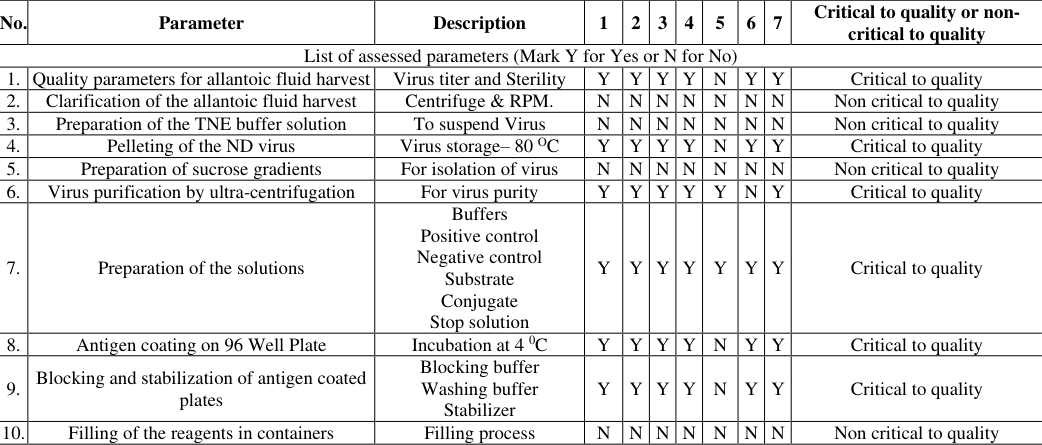 Table 5
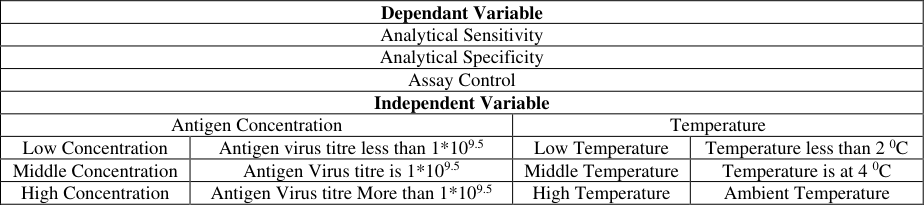 Table 6
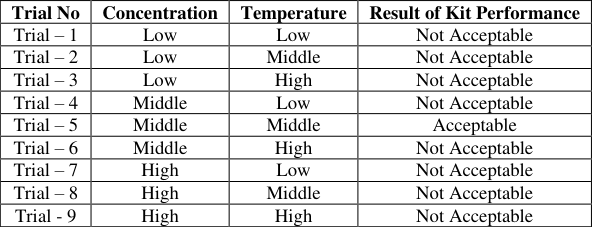 Table 7
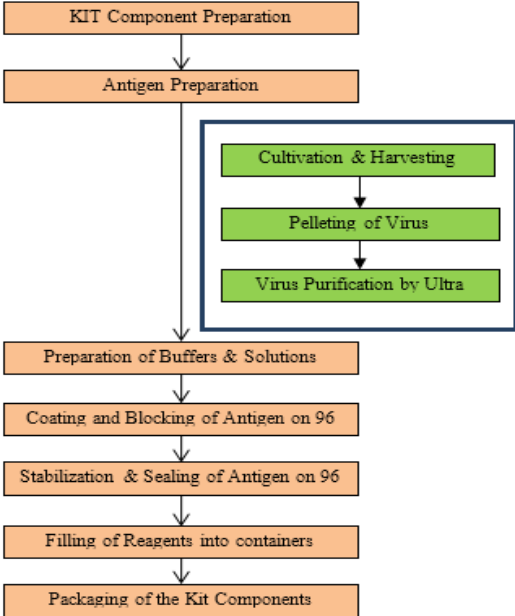 Figure 2
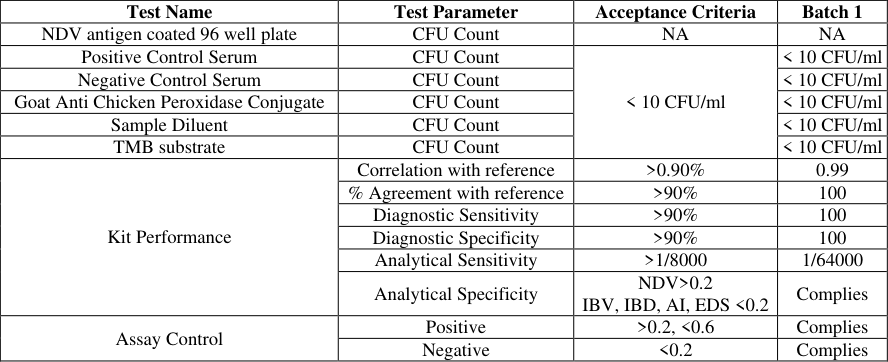 Table 8
Introduction
New castle disease (ND) is one of the most important diseases affecting chicken throughout the world. NDV antibody test kit is an enzyme linked immunosorbent assay for the detection of antibody against New Castle Disease virus in chicken serum samples in which NDV antigen is coated on the 96 wells. Statistics show a 2% increase per annum in the agricultural production during the last 30 years, while the growth in the poultry sector has been 12%. The annual average growth shown by the Indian broiler industry is about 10% and has been characterized as steady but volatile. Statistics of year 2011-12 shows that egg production is around 66.45 billion and poultry meat production is estimated to be about 2.47 million tonnes. Exports of poultry products are at around 531.65 crore for year 2016-17 as per the report of APEDA (Agricultural & processed food products export development authority) [1] . As the new castle disease most impacting disease to the poultry for production of eggs and meats, a quick detection of the new castle disease antibody in poultry can become more beneficial. QbD approach for the new castle disease describes characteristic which are essential to quality from end user's point of view and coverts them into critical quality attributes (CQAs) that product should have [2] . QbD was first defined by the Dr. Joseph M. Juran. Juran indorse that most quality issues and crises arise due to a deficiency of importance allotted to it during product planning. To secure the quality of the manufactured products, QbD is an essential conversion from the traditional quality by testing (QbT) view, which determines the product's quality by conforming it with approved regulatory specifications at the end of the manufacturing process [3] .
1.1 Steps for the approach of the life cycle management [4,5] At the stage of the technology transfer from the lab scale to the commercial scale, risk assessment at the commercial scale is to be performed. Process validation is to be performed and results of the same are to be evaluated before commencing the final commercial manufacturing of the product. Change management at this stage for the commercial scale is to be done. Changed and revised risk assessment is to be done in case of the changes and deviations. Quality management system elements to be used at this phase including change control, failure analysis and effective Corrective Actions and Preventive Actions (CAPA).
Phase -3: Post Manufacturing Phase
Once the product manufacturing technology is transferred from R&D scale to commercial scale, and by managing such changes product quality improvement can be done as a phase of the continual improvement and post approval of the regulatory changes. At this phase also quality management system elements are used. All critical to quality (CtQ) parameters shall be identified using comprehensive evaluation plan and identified CtQ settings shall be further evaluated.
Parameter evaluation: The answers to the following questions will be used to aid in determining if a parameter is considered critical to quality or non-critical to quality. An affirmative answer to questions 1 through 7 generally indicates that the parameter is critical. The parameter directly impacts acceptance or rejection of the product.
2
The parameter represents control characteristics for a physical, chemical, biological, or microbiological property that affects product quality. 3
Failure of the parameter has a direct effect on product quality. 4
Information from this parameter is recorded as part of the production record, lot release data or other GMP data. 5
The parameter is used as a direct measurement of a drug product or its excipients to ensure product quality. 6
The parameter controls critical process elements that may affect product quality, without independent verification. 7
The parameter is considered an Acceptable Quality Limit (A parameter or tooling used to set an in-process quality limit).
2.4
Step 4: Design space ND antibody test kit can be having specificity for the ND virus antibody among the broad range of the antibody detection for the IBV (Infectious Bronchitis Virus), AE (Avian Influenza), IBD (Infectious Bursal Disease), EDS (Egg Drop Syndrome) and ND (New Castle Disease). The testing of the same is to be done and results are to be evaluated during the experimental work. ND antibody test kit response cannot be altered by the presence of the any other antibody as the antigen-antibody reaction is very specific.
Varying concentration of the antigen and process temperature are to be tested and results are to be evaluated.
Step 5: Design of Experiment
For the Design of the Experiment for the NDV antibody detection test kit, full factorial design is to be used in which identified variable are as below. Among them two Independent variables at the three different levels using the 3 2 full factorial model are to be performed. Based on the Design Space and Design of Experiment, set of experiment conducted and optimize result for the diagnostic kit observed for the middle level concentration (Virus Titre 1*10 9.5 EID50) and middle level process temperature (Incubation at the temperature 4 0 C).
Antigen Preparation 3.2.1 Cultivation and Harvesting
NDV antigen was prepared using the whole virus grown in chicken embryo. The lasota strain of NDV was used as master seed after quality control check to assure its purity and free of extraneous pathogens. SPF (Specific Pathogen Free) eggs were inoculated at 10 day old embryonic stage by allantoic cavity route following the standard laboratory procedures. Embryos were further incubated in humidified temperature controlled egg incubator. Allantoic fluid harvest was collected on day 4 of inoculation and stored at 2-8 o C until processed.
Pelleting Of Virus
The allantoic fluid harvest was initially subjected to low speed centrifugation to remove cell debris followed by high speed centrifugation to pellet the virus particles. ND virus is to be pelleted by high speed centrifugation in centrifuge tubes at 2000 RPM for at least 3 hours at 4 °C using the type Z36 HK centrifuge machine. Supernatant is to be discarded. Pellets are to be rehydrated in 300 µl of TNE buffer to each tube and keep it to overnight at 4°C cold room pellets are resuspended by vortexing. Re-suspended virus is to be pulled and to be stored at 80 °C deep freezer.
Virus purification by ultra-centrifugation
Virus purification is done by overlaying the re-suspended pelleted virus on top of the stabilized sucrose gradient and centrifugation the tubes at 1, 00,000 RPM for 3 hours. The distinct virus band is collected and repurified using the same gradient twice. Finally band was collected and pelleted by centrifugation over 30% sucrose gradient at 1, 00,000 RPM for 1 hour. Final virus pellet is rehydrated in 1ml of TNE buffer overnight at 4 °C and resuspended by vortexing. The virus quantity is determined by protein estimation at A280 by Nan drop spectrophotometer, divided into aliquots of 250 µl, labelled and stored at -80° C deep freezer until further use.
Preparation of the TNE & Other buffer solution
TNE Buffer, Conjugate Diluent, Blocking buffer, Coating Buffer, Phosphate citrate buffer, 10% BSA, 10% Thiomersal, Sample Diluent, Washing buffer, Antigen stabilizer, PBS solution, TMB in DMSO solution, 10% Sodium Azide and 50% Tween 20 are to be prepared and tested as per specifications.
Coating, Blocking & Stabilization Of NDV Antigen On 96 Well Plates
Dissolve purified virus at antigen concentration (NDV: 3µg/ml) in coating buffer. Dispense 100 µl of diluted virus antigen to the wells of 96 well plates. Cover plate with lead/aluminium foil and incubate at 4 o C for overnight. Discard unbound antigen to the appropriate vessel containing decontaminating agent. Add 200 µl of blocking buffer to each well. Incubate for 2 hours at room temperature Wash plate once with 300ul of washing buffer & tap each plate onto absorbent material to remove any residual was fluid. Add 200 µl of antigen stabilizer to each well. Discard stabilizer solution to the appropriate vessel containing decontaminating agent and tap each plate onto absorbent material to remove any residual solution. Air dry the plate in laminar flow.
Preparation of the final kit
Preservatives, Sample diluent, Positive control, and Negative control reagents contains sodium azide as preservative at a final concentration of 0.01%. Conjugated antibody solution contains thimerosal as preservative at a final concentration of 0.01%. Analytical sensitivity (limit of detection): For the Dilution D1 which is 1:500 to D128 which is 1:64000 positive cut off value is to be found and result recorded. Analytical specificity: S/P ratio is to be calculated for the NDV, IBV, IBD, AI and EDS nonspecific sera.
Post experimental
Post experimental
Finish product testing
Finish product testing
Conclusion
QTPP for the NDV antibody detection kit was determined based on the literature review and requirement of the customer. Based on the QTPP identified, all possible Quality Attributes for the NDV antibody detection kit were identified.
Risk assessment for all identified Quality Attributes was performed. Result of the risk assessment has provided CQAs. Dependant and independent variables associated with the manufacturing process of the NDV antibody detection kit were identified and among them 3 2 full factorial model was performed for 3 levels and 2 independent factors. Among all 8 Trials, Trial with optimum results was selected for the manufacturing process of NDV antibody detection kit.
By performing the FMEA model for the manufacturing process, all the procedural steps were found under control so no additional control or mitigation plan for risk required. Designed manufacturing process with identified CQA performed and final performance of the NDV antibody detection kit along with the testing of the identified QTPP in the NDV antibody detection kit.
As a result of experimental works reveals, all the QTPP identified and designed obtained in NDV antibody detection kit which provide the performance as defined in identified and designed QTPP.
References
References
Figures and tables from the paper
| Kit components | Visual appearance | Stability | Sterile status |
|---|---|---|---|
| NDV antigen coated 96 well plate | NA | Stable | NA |
| Positive control serum | Colourless | Stable | Sterile |
| Negative control serum | Colourless | Stable | Sterile |
| Goat anti-chicken peroxidase conjugate | Colourless | Stable | Sterile |
| Sample diluent | Colourless | Stable | Sterile |
| TMB (Teramethyl benzidine) substrate | Colourless | Stable | Sterile |
| Stop solution | Colourless | Stable | Sterile |
Table text extracted from the original PDF; superscript letters are shown inline. The original table image is below.
View original table image
| QTPP | CQA |
|---|---|
| Correlation with reference | Source of harvest & testing Pelleting of the ND virus Preparation o sucrose gradients |
| % Agreement with reference | Source of harvest & testing Pelleting of the ND virus Preparation of sucrose gradients |
| Diagnostic Sensitivity | Preparation of the TNE buffer solution Preparation of the solutions |
| Diagnostic Specificity | Clarification of the allantoic fluid harvest Preparation of the solutions |
| Analytical Sensitivity | Preparation of the TNE buffer solution Preparation of the solutions |
| Analytical Specificity | Clarification of the allantoic fluid harvest Preparation of the solutions |
| Reproducibility | Preparation of the TNE buffer solution Antigen coating on 96 well plate Blocking and stabilization of antigen coated plates Sealing of antigen coated plates Filling of the reagents in containers |
Table text extracted from the original PDF; superscript letters are shown inline. The original table image is below.
View original table image
| Sr. No | Component Criticality Assessment Criteria |
|---|---|
| 1 | The parameter directly impacts acceptance or rejection of the product. |
| 2 | The parameter represents control characteristics for a physical, chemical, biological, or microbiological property that affects product quality. |
| 3 | Failure of the parameter has a direct effect on product quality. |
| 4 | Information from this parameter is recorded as part of the production record, lot release data or other GMP data. |
| 5 | The parameter is used as a direct measurement of a drug product or its excipients to ensure product quality. |
| 6 | The parameter controls critical process elements that may affect product quality, without independent verification. |
| 7 | The parameter is considered an Acceptable Quality Limit (A parameter or tooling used to set an in-process quality limit). |
Table text extracted from the original PDF; superscript letters are shown inline. The original table image is below.
View original table image
| No. | Parameter | Description | 1 | 2 | 3 | 4 | 5 | 6 | 7 | Critical to quality or non- critical to quality |
|---|---|---|---|---|---|---|---|---|---|---|
| List of assessed parameters (Mark Y for Yes or N for No) | ||||||||||
| 1. | Quality parameters for allantoic fluid harvest | Virus titer and Sterility | Y | Y | Y | Y | N | Y | Y | Critical to quality |
| 2. | Clarification of the allantoic fluid harvest | Centrifuge & RPM. | N | N | N | N | N | N | N | Non critical to quality |
| 3. | Preparation of the TNE buffer solution | To suspend Virus | N | N | N | N | N | N | N | Non critical to quality |
| 4. | Pelleting of the ND virus | Virus storage– 80 OC | Y | Y | Y | Y | N | Y | Y | Critical to quality |
| 5. | Preparation of sucrose gradients | For isolation of virus | N | N | N | N | N | N | N | Non critical to quality |
| 6. | Virus purification by ultra-centrifugation | For virus purity | Y | Y | Y | Y | Y | N | Y | Critical to quality |
| 7. | Preparation of the solutions | Buffers Positive control Negative control Substrate Conjugate Stop solution | Y | Y | Y | Y | Y | Y | Y | Critical to quality |
| 8. | Antigen coating on 96 Well Plate | Incubation at 4 0C | Y | Y | Y | Y | N | Y | Y | Critical to quality |
| 9. | Blocking and stabilization of antigen coated plates | Blocking buffer Washing buffer Stabilizer | Y | Y | Y | Y | N | Y | Y | Critical to quality |
| 10. | Filling of the reagents in containers | Filling process | N | N | N | N | N | N | N | Non critical to quality |
Table text extracted from the original PDF; superscript letters are shown inline. The original table image is below.
View original table image
| Dependant Variable | — | — | — |
|---|---|---|---|
| Analytical Sensitivity | |||
| Analytical Specificity | |||
| Assay Control | |||
| Independent Variable | |||
| Antigen Concentration | Temperature | ||
| Low Concentration | Antigen virus titre less than 1*109.5 | Low Temperature | Temperature less than 2 0C |
| Middle Concentration | Antigen Virus titre is 1*109.5 | Middle Temperature | Temperature is at 4 0C |
| High Concentration | Antigen Virus titre More than 1*109.5 | High Temperature | Ambient Temperature |
Table text extracted from the original PDF; superscript letters are shown inline. The original table image is below.
View original table image
| Trial No | Concentration | Temperature | Result of Kit Performance |
|---|---|---|---|
| Trial – 1 | Low | Low | Not Acceptable |
| Trial – 2 | Low | Middle | Not Acceptable |
| Trial – 3 | Low | High | Not Acceptable |
| Trial – 4 | Middle | Low | Not Acceptable |
| Trial – 5 | Middle | Middle | Acceptable |
| Trial – 6 | Middle | High | Not Acceptable |
| Trial – 7 | High | Low | Not Acceptable |
| Trial – 8 | High | Middle | Not Acceptable |
| Trial - 9 | High | High | Not Acceptable |
Table text extracted from the original PDF; superscript letters are shown inline. The original table image is below.
View original table image
| Test Name | Test Parameter | Acceptance Criteria | Batch 1 |
|---|---|---|---|
| NDV antigen coated 96 well plate | CFU Count | NA | NA |
| Positive Control Serum | CFU Count | < 10 CFU/ml | < 10 CFU/ml |
| Negative Control Serum | CFU Count | < 10 CFU/ml | |
| Goat Anti Chicken Peroxidase Conjugate | CFU Count | < 10 CFU/ml | |
| Sample Diluent | CFU Count | < 10 CFU/ml | |
| TMB substrate | CFU Count | < 10 CFU/ml | |
| Kit Performance | Correlation with reference | >0.90% | 0.99 |
| % Agreement with reference | >90% | 100 | |
| Diagnostic Sensitivity | >90% | 100 | |
| Diagnostic Specificity | >90% | 100 | |
| Analytical Sensitivity | >1/8000 | 1/64000 | |
| Analytical Specificity | NDV>0.2 IBV, IBD, AI, EDS <0.2 | Complies | |
| Assay Control | Positive | >0.2, <0.6 | Complies |
| Negative | <0.2 | Complies |
Table text extracted from the original PDF; superscript letters are shown inline. The original table image is below.