
Research article · 2018 · Full text
International Journal of Statistics and Applied MathematicsUsing data envelopment analysis to measure, relative efficiency of public and private life insurance companies in India
Volume 3(1) · Pages 173–176
Research areasInsurance and Financial Risk ManagementAgricultural risk and resilience
Abstract
Author-writtenIn this study Data envelopment analysis used to measure the relative efficiency of public and private life insurance companies in India by year wise and group wise. This study used two inputs commission and operating expenses and one output namely investment income. This study used 01 public insurance company and 13 private insurance companies covering a period of 5 years from 2011-12 to 2015-16. The focus of this study is to maximise the output in minimum input. The result of this study show that in group wise analysis of company the mean of scale efficiency of private companies is 0.8151 in year 2011-12 to 0.9615 in year 2015-16.LIC is operating on increasing return to scale and taking the more advantage of pure technical efficiency and scale efficiency and selected public and private life insurance companies at an output oriented overall performance average technical efficiency is 62.424%, pure technical efficiency is 75.49285714% and scale efficiency is 85.57833.
Summary
Source-checkedPlain-language reading of the full paper, prepared with AI and checked against the text. Each point links to the authors' own words.
Why it matters
- Life insurance is considered essential for financial planning as it protects money and ensures growth for overall financial well-being. View evidence ↗
- Data Envelopment Analysis (DEA) is a linear programming model used to evaluate the relative efficiency of decision-making units using multiple inputs and outputs. View evidence ↗
The question
- The study aims to analyze and measure the efficiency of public and private life insurance companies in India from 2011 to 2016 using DEA. View evidence ↗
What they did
- The research analyzed 1 public and 13 private insurance companies over a five-year period from 2011-12 to 2015-16. View evidence ↗
- The efficiency was measured using two inputs, commission and operating expenses, and one output, which was investment income. View evidence ↗
- The researchers employed an output-oriented DEA model for their analysis. View evidence ↗
What they found
- The Life Insurance Corporation of India (public sector) was found to be efficient for all studied periods except for the year 2014-15. View evidence ↗
- The mean scale efficiency for private companies increased from 0.8151 in 2011-12 to 0.9615 in 2015-16. View evidence ↗
- The mean technical efficiency for private companies generally increased from 0.55 in 2011-12 to 0.67 in 2015-16, despite decreases in 2012-13 and 2014-15. View evidence ↗
- LIC operates on increasing returns to scale and leverages pure technical and scale efficiency more effectively than others. View evidence ↗
What it means
- The authors conclude that private life insurance companies in India lag behind the public life insurance company in terms of efficiency. View evidence ↗
- The authors suggest that private companies can reach optimum performance by improving their management of operating expenses and commissions to increase investment income. View evidence ↗
- Inefficient companies experiencing increasing returns to scale are recommended to expand their business by increasing their inputs. View evidence ↗
Visual summary
2 visualsIllustrations explain the paper; charts are replotted from the paper's own table values.

DEA Input-Output Model
AI-generated conceptual illustration (Life insurance company office buildings). It explains the idea and does not show study data.
View source evidence ↗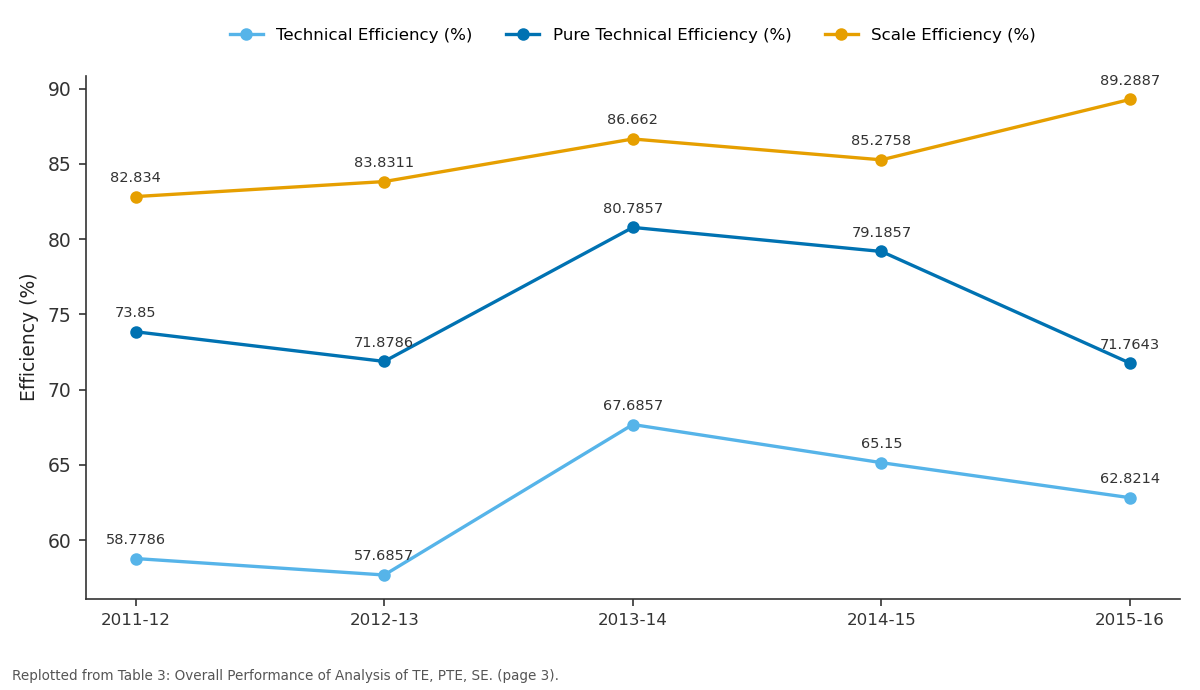
Technical Efficiency (%) and Pure Technical Efficiency (%) and more: 2011-12 vs 2012-13 vs 2013-14 vs 2014-15 vs 2015-16
Replotted from Table 3 (page 3) of the original paper. Every bar is the paper's own table value.
View source evidence ↗Figures & tables
From the original paper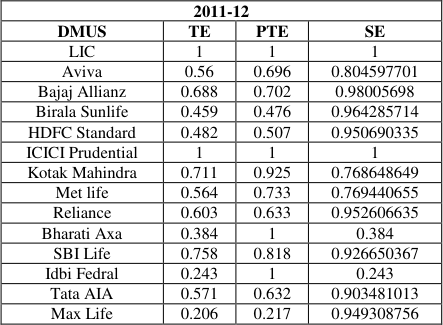 Table 1
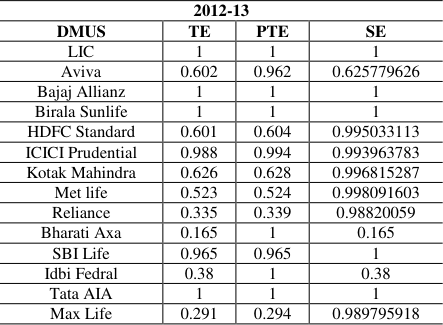 Table 1
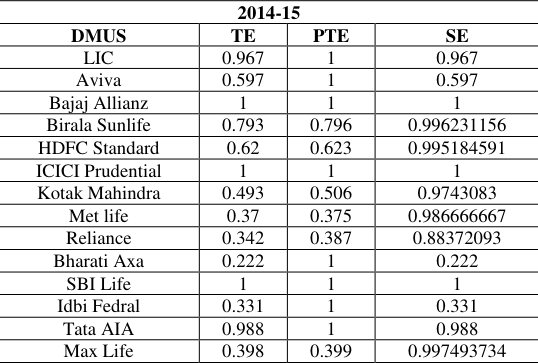 Table 1
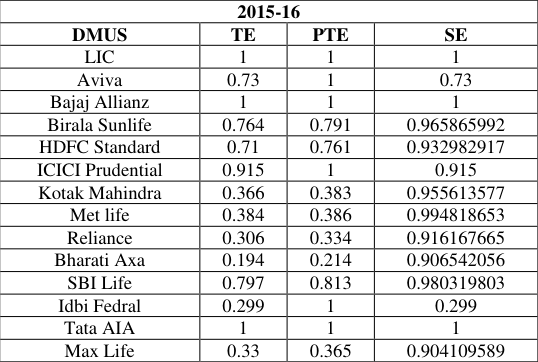 Table 1
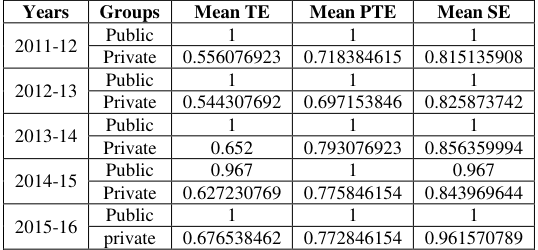 Table 2
 Table 3
Introduction
Life Insurance is the key to good financial planning it gives you safeguards your money and ensures its growth, thus providing you with complete financial well being. In Life Insurance it is an agreement between the policy owner and the insurer. If insurer agrees to pay a sum of money upon the insurance like insured individual's or individuals' death or other event, such as terminal illness, critical illness or maturity of the policy. Data Envelopment Analysis (DEA) is a linear programming based model which evaluates the relative efficiency of decision making units (DMUs), with multiple inputs and outputs. DEA methodology was developed by Charnes, Cooper and Rhodes (1978) [1] (CCR), efficiency is the ratio of a weighted sum of outputs to a weighted sum of inputs, where the weights structure is calculated by means of mathematical programming and constant returns to scale (CRS) are assumed. In 1984, Banker, Charnes and Cooper developed a model (BCC) with variable returns to scale (VRS). To analyze the performance of the public and private life insurance companies in India, this study measures the efficiency of life insurance companies in India for the year 2011-2016 by using Data Envelopment Analysis. The measuring efficiency of insurance companies in India, this study use the output input data which use 14 life insurance companies. This study utilizes two inputs namely, operating expenses and commission and one output, namely investment income.
Review of Literature
A new definition of efficiency with data for multi-input and multi-output was developed by Charnes, Cooper and Rhodes (1978) [6] provided a non-linear programming problem. The initial studies on the efficiency of U.S. life insurers, the study was focused on scale economies. From this study result found that larger firms generallywere found to exhibit decreasing returns to scale. Examine the relationship among mergers and acquisitions, efficiency, and economies of scale in the US life insurance industry for the period1988 to 1995 used Data Envelopment Analysis.
Result was found that acquired firms achieve greater efficiency gains than firms that have not been involved in mergers or acquisitions. Davutyan, Klumpes (2008) used Data Envelopment Analysis for studied Scale Efficiency, Technical efficiency and Pure Technical Efficiency. For that study they used inputs namely labor, business service, equity capital and used outputs namely premiums and invested asset. The result was found that the efficiency score was very low in seven European countries. In non life insurers Switzerland was the best and Spain was the worst. In life insurance France was the best and Netherlands was the worst. Hussels, Ward (2006) used data envelopment analysis to analyzed the cost efficiency and technical efficiency of 47 life insurers of U.K. and31 life insurers of Germany over the period 1991 to 2002. The result concluded that the cost and technical efficiency of U.K. was greater than Germany. There was limited evidence of improvement in post deregulation efficiency and limited influence of deregulation on efficiency. Zijiang Yang (2006) [3] introduced a new two-stage DEA model to evaluated systematic efficiency for the Canadian Life and health insurance industry. Result was concluded that the Canadian L&H insurance industry operated fairly efficiently during the examined period. 1998).
Data Sources and Methodology
For this study data have been collected from secondary source i.e. year wise annual report of Regularity and Development Authority of India (IRDA) of 14 public and private life insurance companies in India for the period 2011-12 to 2015-16.For this study companies included, Aviva Life Insurance In this study two inputs and one output are used to find out efficiency of public and private life insurance companies in India. Two inputs are operating expenses and commission and outputs is investment income. Data Envelopment Analysis (DEA) is a linear programming based model which evaluates the relative efficiency of decision making units (DMUs), with multiple inputs and outputs. In DEA methodology, formerly developed by Charnes, Cooper and Rhodes (1978) [6] (CCR), efficiency is defined as a weighted sum of outputs to a weighted sum of inputs, where the weights structure is calculated by means of mathematical programming and constant returns to scale (CRS) are assumed. In 1984, Banker, Charnes and Cooper developed a model (BCC) with variable returns to scale (VRS).
Returns to Scale:
In production theory the change in output levels due to changes in input levels is termed as returns to scale. Returns to scale can be constant or variable. Constant returns to scale (CRS) implies that an increase in input levels by a certain proportion results in an increase in output levels by the same proportion. Variable returns to scale (VRS) implies that an increase in the input levels need not necessarily result in a proportional increase in output levels i.e., the output levels can increase (increasing returns to scale) or the output levels can decrease (decreasing returns to scale) by a different proportion than the input increment Data envelopment was developed for performance measurement. The DEA methodology helps to identify inefficient DMUs as well as the sources and amounts of inefficiency of inputs and/or outputs.
This study has used output oriented DEA model.
Results
Results
Analysis based on Technical Efficiency, Pure Technical
Efficiency and Scale Efficiency: The analysis of public and private life insurance companies in India year wise and group wise has done by using Scale efficiency, Technical efficiency and pure technical efficiency.
Year wise analysis: Table 1 shows that the year wise efficiencies of public and private life insurance companies in India over the period 2011-12 to 2015-16. This has been done to find out the year wise efficiencies of various companies under consideration i.e. the effort has been made to find out the year in which companies have more efficiency. From this result life insurance corporation of India which is from public sector is efficient for all the period except year 2014-15 and from private sector, SBI life insurance, ICICI prudential, Aviva, Birla Sunlife, Tata TIA and Bajaj Allianz are some time efficient. Most of the selected insurance companies are found to be efficient in the year 2013-14, 2014-15, 2015-16.
| 2015-16 | — | — | — |
|---|---|---|---|
| DMUS | TE | PTE | SE |
| LIC | 1 | 1 | 1 |
| Aviva | 0.73 | 1 | 0.73 |
| Bajaj Allianz | 1 | 1 | 1 |
| Birala Sunlife | 0.764 | 0.791 | 0.965865992 |
| HDFC Standard | 0.71 | 0.761 | 0.932982917 |
| ICICI Prudential | 0.915 | 1 | 0.915 |
| Kotak Mahindra | 0.366 | 0.383 | 0.955613577 |
| Met life | 0.384 | 0.386 | 0.994818653 |
| Reliance | 0.306 | 0.334 | 0.916167665 |
| Bharati Axa | 0.194 | 0.214 | 0.906542056 |
| SBI Life | 0.797 | 0.813 | 0.980319803 |
| Idbi Fedral | 0.299 | 1 | 0.299 |
| Tata AIA | 1 | 1 | 1 |
| Max Life | 0.33 | 0.365 | 0.904109589 |
Table text extracted from the original PDF; superscript letters are shown inline. The original table image is below.
View original table image
| 2014-15 | — | — | — |
|---|---|---|---|
| DMUS | TE | PTE | SE |
| LIC | 0.967 | 1 | 0.967 |
| Aviva | 0.597 | 1 | 0.597 |
| Bajaj Allianz | 1 | 1 | 1 |
| Birala Sunlife | 0.793 | 0.796 | 0.996231156 |
| HDFC Standard | 0.62 | 0.623 | 0.995184591 |
| ICICI Prudential | 1 | 1 | 1 |
| Kotak Mahindra | 0.493 | 0.506 | 0.9743083 |
| Met life | 0.37 | 0.375 | 0.986666667 |
| Reliance | 0.342 | 0.387 | 0.88372093 |
| Bharati Axa | 0.222 | 1 | 0.222 |
| SBI Life | 1 | 1 | 1 |
| Idbi Fedral | 0.331 | 1 | 0.331 |
| Tata AIA | 0.988 | 1 | 0.988 |
| Max Life | 0.398 | 0.399 | 0.997493734 |
Table text extracted from the original PDF; superscript letters are shown inline. The original table image is below.
View original table image
| 2012-13 | — | — | — |
|---|---|---|---|
| DMUS | TE | PTE | SE |
| LIC | 1 | 1 | 1 |
| Aviva | 0.602 | 0.962 | 0.625779626 |
| Bajaj Allianz | 1 | 1 | 1 |
| Birala Sunlife | 1 | 1 | 1 |
| HDFC Standard | 0.601 | 0.604 | 0.995033113 |
| ICICI Prudential | 0.988 | 0.994 | 0.993963783 |
| Kotak Mahindra | 0.626 | 0.628 | 0.996815287 |
| Met life | 0.523 | 0.524 | 0.998091603 |
| Reliance | 0.335 | 0.339 | 0.98820059 |
| Bharati Axa | 0.165 | 1 | 0.165 |
| SBI Life | 0.965 | 0.965 | 1 |
| Idbi Fedral | 0.38 | 1 | 0.38 |
| Tata AIA | 1 | 1 | 1 |
| Max Life | 0.291 | 0.294 | 0.989795918 |
Table text extracted from the original PDF; superscript letters are shown inline. The original table image is below.
View original table image
| 2011-12 | — | — | — |
|---|---|---|---|
| DMUS | TE | PTE | SE |
| LIC | 1 | 1 | 1 |
| Aviva | 0.56 | 0.696 | 0.804597701 |
| Bajaj Allianz | 0.688 | 0.702 | 0.98005698 |
| Birala Sunlife | 0.459 | 0.476 | 0.964285714 |
| HDFC Standard | 0.482 | 0.507 | 0.950690335 |
| ICICI Prudential | 1 | 1 | 1 |
| Kotak Mahindra | 0.711 | 0.925 | 0.768648649 |
| Met life | 0.564 | 0.733 | 0.769440655 |
| Reliance | 0.603 | 0.633 | 0.952606635 |
| Bharati Axa | 0.384 | 1 | 0.384 |
| SBI Life | 0.758 | 0.818 | 0.926650367 |
| Idbi Fedral | 0.243 | 1 | 0.243 |
| Tata AIA | 0.571 | 0.632 | 0.903481013 |
| Max Life | 0.206 | 0.217 | 0.949308756 |
Table text extracted from the original PDF; superscript letters are shown inline. The original table image is below.
View original table image
Conclusion
From this study result found that in group wise analysis of company the mean of scale efficiency of private companies is 0.8151 in year 2011-12 to 0.9615 in year 2015-16.LIC is operating on increasing return to scale and taking the more advantage of pure technical efficiency and scale efficiency. We observe that private life insurance companies are behind the public life insurance company. We observe that if private companies are improved in operating expenses and commission then their investment income will go to high and less efficient companies can successfully achieve the optimum performance level. From this result we can say that those inefficient companies which having increasing return to scale then they should expand their business by increasing their input. They have to increase their quality of service, customer's product choice then inefficient companies will be efficient.
Figures and tables from the paper
| Years | Groups | Mean TE | Mean PTE | Mean SE |
|---|---|---|---|---|
| 2011-12 | Public | 1 | 1 | 1 |
| Private | 0.556076923 | 0.718384615 | 0.815135908 | |
| 2012-13 | Public | 1 | 1 | 1 |
| Private | 0.544307692 | 0.697153846 | 0.825873742 | |
| 2013-14 | Public | 1 | 1 | 1 |
| Private | 0.652 | 0.793076923 | 0.856359994 | |
| 2014-15 | Public | 0.967 | 1 | 0.967 |
| Private | 0.627230769 | 0.775846154 | 0.843969644 | |
| 2015-16 | Public | 1 | 1 | 1 |
| private | 0.676538462 | 0.772846154 | 0.961570789 |
Table text extracted from the original PDF; superscript letters are shown inline. The original table image is below.
View original table image
| Years | Company | Technical Efficiency (%) | Pure Technical Efficiency (%) | Scale Efficiency (%) |
|---|---|---|---|---|
| 2011-12 | All selected Insurance Companies | 58.77857143 | 73.85 | 82.8340486 |
| 2012-13 | All selected Insurance Companies | 57.68571429 | 71.87857143 | 83.83113319 |
| 2013-14 | All selected Insurance Companies | 67.68571429 | 80.78571429 | 86.66199942 |
| 2014-15 | All selected Insurance Companies | 65.15 | 79.18571429 | 85.2757527 |
| 2015-16 | All selected Insurance Companies | 62.82142857 | 71.76428571 | 89.28871609 |
Table text extracted from the original PDF; superscript letters are shown inline. The original table image is below.
View original table image
References
7 in the original paper- Charnes A, Cooper WW, Rhodes E. Measuring the efficiency of decision making units, European Journal of Operational Research. 1978; 2:429-444.
- Cooper W, Seiford L, Tone K. Data Envelopment Analysis. Acomprehensive text with models, applications, references and DEA Solver software, Kluwer Academic Publishers, 1999, 253.
- Yang Z. A two-stage DEA model to evaluate the overall performance of Canadian life and health insurance companies, Mathematical and Computer Modelling, 2006; 43(7-8):910-919.
- Borges MR, Nektarios M, Barros CP. Analysing the efficiency of the Greek life Insurance industry. European Research Studies Journal. 2008; 11(3):35-52.
- Hu X, Zhang C, Hu JL, Zhu N. Analyzing efficiency in the Chinese life insurance industry, Management Research News. 2009; 32(10):905-920.
- Charnes A, Cooper WW, Rhodes E. Measuring the Efficiency of Decision Making Units. European Journal of Operational Research. 1978; 2:429-444.
- Banker R, Charnes A, Cooper WW. Some models for estimating technical and scale inefficiencies in data envelopment analysis, Management Science. 1984; 30:1078-1092.
Cited by 1
From OpenAlex, OpenCitations and reference lists read by Scinovex
- Efficiency Analysis of Companies Producing Motor Car Insurance Between 2017 – 2021 with DEA and TOPSIS Methods ↗
Enes AKKURT, Abdurrahman OKUR · Journal of Banking and Financial Research · 2022
Trafiğe kayıtlı araç sayısının her geçen gün artmasıyla birlikte kasko sigortasının yaygınlığı artmaktadır. Kasko sigortasının bu kadar yaygınlık göstermesi, sigorta şirketleri açısından etkinlik ve performans düzeylerinin saptanması hususunu gündeme getirmiştir. Etkinlik düzeyleri ile şirketlerin verimlilikleri, zayıf ve güçlü yönleri tespit edilmektedir. Bu çalışmada Veri Zarflama Analizi (VZA) ve TOPSIS Yöntemi kullanılmıştır. Analizde Çıktı Yönlü CCR ve TOPSIS Yöntemi uygulanmıştır. Çıktı…
❝ 3PDF