
Research article · 2018 · Full text
International Journal of Statistics and Applied MathematicsDeveloping double acceptance sampling plans for percentiles based on the inverse Rayleigh distribution
Volume 3(1) · Pages 39–44
Research areasStatistical Distribution Estimation and Applications
Abstract
Author-writtenIn this research, double acceptance sampling plan is developed for the inverse Rayleigh distribution using percentiles when the life test is truncated at a pre-specified time. This is because the population mean used in our most researches can be influence mostly by the extreme values and as such may not satisfy the requirement for most life related distributions; moreover, most of the employed life distributions are not symmetric (Rao, 2015). This research also serves as an extension to Rao, Kantam, Rosaiah and Reddy (2012) where a similar work was done but using a simple (single) sampling plan. The minimum sample sizes n1 and n2 necessary to ensure the specified life percentile is obtained under a given customer’s risk. The operating characteristic values of the sampling plans as well as the producer’s risk are presented.
Summary
Source-checkedPlain-language reading of the full paper, prepared with AI and checked against the text. Each point links to the authors' own words.
Why it matters
- Quality control is a critical business strategy used to improve product reliability and reduce costs for consumers. View evidence ↗
- Variable sampling plans are generally preferred over attribute sampling plans because they can protect both producers and consumers using smaller sample sizes. View evidence ↗
- Using the population mean to design sampling plans can be inadequate when life distributions are skewed or non-symmetric. View evidence ↗
The question
- The study aims to develop a double acceptance sampling plan based on percentiles for the inverse Rayleigh distribution during truncated life tests. View evidence ↗
What they did
- The researchers chose a double acceptance sampling plan because it is more efficient regarding required sample size than a single sampling plan. View evidence ↗
- To illustrate the plan, the authors used a real-world dataset consisting of the lifetimes of 40 transistors. View evidence ↗
What they found
- The transistor lifetime data was found to fit the inverse Rayleigh model well, as indicated by a Kolmogorov-Smirnov test p-value of 0.998. View evidence ↗
- The study found that the probability of acceptance in their proposed plan increases as the ratio percentile increases. View evidence ↗
- The proposed double acceptance sampling plan was found to be more economical than the compared single sampling plan. View evidence ↗
What it means
- The authors conclude that their plan reduces the risk of customers accepting poor-quality lots. View evidence ↗
- The authors recommend the proposed plan as a more economical alternative to single sampling plans based on percentiles. View evidence ↗
Figures & tables
From the original paper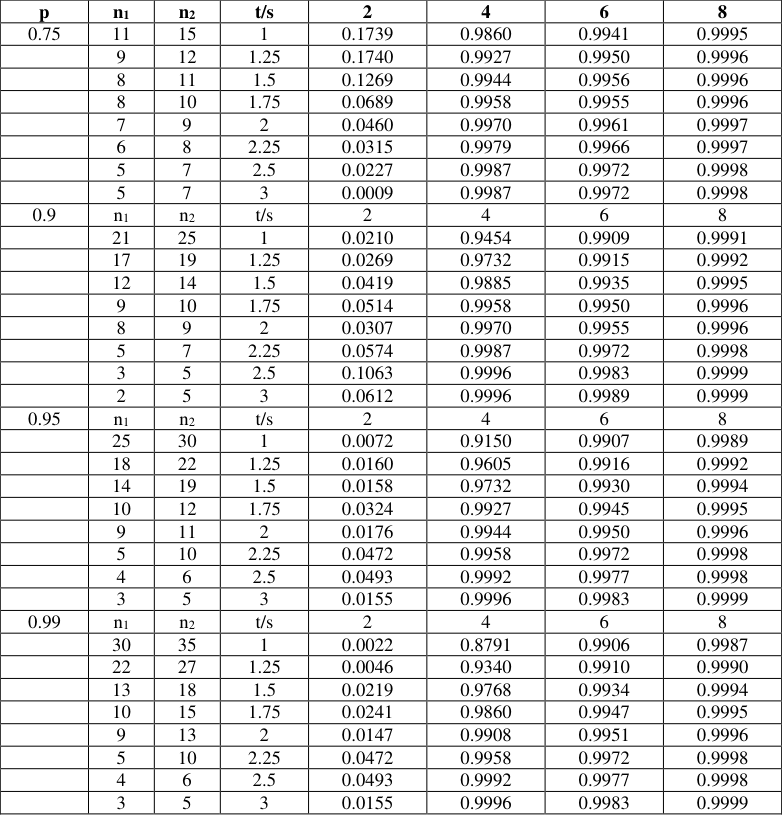 Table 1
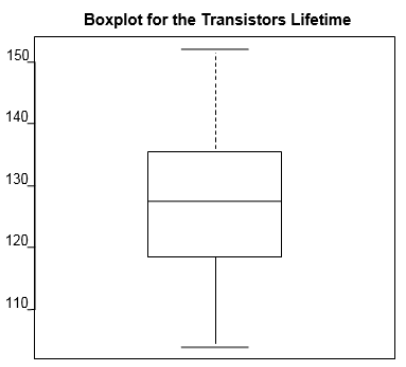 Figure 1
Introduction
Quality has now become an important aspect for consumer when making choice among different products or services. Thus, quality control has become an important business strategy to reduce cost and improve reliability (Yan et al., 2017) [25] . The acceptance sampling plans (ASP) are important tools widely used for promoting product quality in the industries. ASP is an inspection procedure concerned with accepting or rejecting a given lot of large size of products on the basis of its quality after inspection of a sample taken from the lot. The ASP is commonly classified as the attribute sampling plan and the variable sampling plan. Variable sampling is superior to the attribute sampling plan, because it provides protection for the producer and the consumer with smaller sample sizes (Seidel 1997) [21] . Thus the variable sampling plan is usually used when the inspection is destructive or the items are expensive. It involves probabilistic distributions and principle of experimental design which provide a ground for these theories to validate basic assumptions in more verifiable and correct inference, than in many biometric and sociometric applications (Montgomery 2009) [14] . Even though the acceptance sampling continually faces many challenges, among the challenges is the requirement to improve product quality while lowering production cost. In most acceptance sampling plans for a truncated life test, the major issue is to determine the sample size from a lot under consideration. If the quality characteristic is regarding the lifetime of a product, the plan becomes a life test. Traditionally, when the life test indicates that the mean life of products exceeds the specified one, the lot of product is accepted, otherwise it is rejected. It also protects the producer in the sense that lots produced at permissible level of quality have a good chance to be accepted by the plan. Acceptance sampling procedures are necessary defensive measures, instituted as protective devices against the threat of deterioration in quality. As such, they should be set up with the aim of discontinuance in favour of process control procedures as soon as possible. In response to these challenges, much effort has been given to finding new technological tools (Schilling and Neubauer, 2008) [20] . Montgomery (2009) [14] highlighted three basic approaches to lot sentencing: (1) accepting without inspection; (2) 100% inspection i.e. removing all defectives unit found; and (3) acceptance sampling. However, upon all the approaches, acceptance sampling is regarded as the most likely useful, especially when the cost of 100% inspecting a product is extremely high, and there may be serious product liability risks of rejecting the lot. Acceptance sampling is based on probability procedure and is the most widely used sampling technique. Many sampling plans are tabled and published; it can be used with little guidance due to simplicity of these tables. Acceptance sampling procedures are necessarily defensive measures, instituted as protective devices against the threat of deterioration in quality. As such, they should be set up with the aim of discontinuance in favour of process control procedures as soon as possible. Process quality control is that aspect of the quality system concerned with monitoring and improving the production process by analysis of trends and signals of quality problems or opportunities for the enhancement of quality. Its methods include various types of control charts, experiment designs, response surface methodologies, evolutionary operations, and other procedures including, on occasion, those of acceptance sampling. These methods are an essential adjunct for effective acceptance control since 1. Quality levels for selecting an appropriate sampling procedure should be determined from control chart analysis to ascertain what minimum levels the producer can reasonably and economically guarantee and what maximum levels can be tolerated by the consumer's process or will fulfill the consumer's wants and needs. 2. Acceptance sampling procedures should be set up to ''self-destruct'' after a reasonable period in favor of process controls on the quality characteristic in question. Simultaneous use of acceptance quality control and process quality should eventually lead to improvement in quality levels to the point that regular application of acceptance sampling is no longer needed.
Thus, at the beginning and at the end of an acceptance sampling procedure, process quality control plays an important part. This research tries to address the problem of determining the minimum number of sample size as well as the probability of acceptance that will give assurances at a specified time which remain the major challenge in the area of acceptance sampling. Unlike our previous work, here we use percentiles in finding the minimum and acceptance number of the plan. Several works regarding this can be found in Rosaiah and Kantam (2005) [11] who developed an acceptance sampling procedure for the inverse Rayleigh distribution mean under a truncated life test. Some other studies regarding truncated life tests can be found in Epstein (1954), Sobel and Tischendrof (1959) [22] , Goode and Kao (1961) [7] , Gupta and Groll (1961) [9] , Gupta (1962) [8] , Fertig and Mann (1980) [6] , Kantam and Rosaiah (1998) [15] , Kantam et al. (2001) [10] , Baklizi (2003) [2] , Tsai and Wu (2006) [24] , Rao et al. (2008) [16] , Balakrishnan et al. (2007) [3] and just recently Yan et al. (2017) [25] . All these authors considered the design of acceptance sampling plans based on the population mean under a truncated life test. Whereas Lio et al. (2010) considered acceptance sampling plans from truncated life tests based on the Birnbaum-Saunders distribution for percentiles and they proposed that the acceptance sampling plans based on mean may not satisfy the requirement of engineering on the specific percentile of strength or breaking stress. When the quality of a specified low percentile is concerned, the acceptance sampling plans based on the population mean could pass a lot which has the low percentile below the required standard of consumers. With the exception of Yan et al. (2017) [25] who uses the coefficient of variation (CV) instead of the usual population mean and claimed to develop a variable repetitive group acceptance sampling based on the CV, the actual interplay remains single acceptance sampling from their practical delineation of the relationship. The general limitation of these works is that the population mean may not adequately describe the central tendency especially when the distribution is skewed. Moreover, most of the employed life distributions are not symmetric. Marshall and Olkin (2007) stated that the mean life may not be adequate in terms of locations. This reduces the feasibility of acceptance sampling plans if developed based on the mean life of products.
Rao et.al (2012) [16] developed an acceptance sampling procedure for the inverse Rayleigh distribution percentile under a truncated life test. Although, the work tries to address the problem of producer's risk by determining the minimum number of sample size necessary to give assurances for accepting the lot but it only uses one sample size. These reasons serve as motivation to developing double acceptance sampling plans based on the percentiles of the inverse Rayleigh distribution. It is known that the double acceptance sampling plan is more efficient than the single sampling plan in terms of the sample size required. (Sudamani and Sutharani, 2013) [23] .
Inverse Rayleigh Distribution
Assume that the lifetime of a product follows an inverse Rayleigh distribution which has the following cumulative distribution function (cdf) and probability density function (pdf) respectively:
and q the 100𝑞 𝑡ℎ percentile (or the q th quantile) as shown by Rao et al. (2012) [16]
The 𝑡 𝑞 increases as q increases, let
To develop acceptance sampling plans for the inverse Rayleigh, the distribution function is replaced by equation 4 and it will become as
F(t) can be written emphasizing its dependence on 𝛿 as:
Taking partial derivative with respect to 𝛿, we have
The usual practice in life testing activities is to terminate the life test by a pre-determined time t, the probability of rejecting a bad lot be at least p* c. Here, the acceptance sampling plan for percentiles under a truncated life test is to set up the minimum sample sizes 12 a n d nn for the given acceptance numbers
Probability of Acceptance for double acceptance sampling (DASP)
In determining the minimum sample sizes in the current paper, for a fixed * p our sampling plans are characterized by
, , , a n d qq n n c c t t
. We assume that the lot size is large enough to sufficiently use the binomial distribution to find the probability of acceptance. In this study the consumer's risk is fixed not to exceed 1-p*, so that p* is a minimum confidence level for a consumer, the minimum sample size should satisfy the following inequality
where 0 1 ( * ) q q t d t pF and 0 q q q t t d . Using (7) the OC values and OC curves can be obtained for any sampling plan 0 , , , , n items in the 1 st sample with an acceptance number 1 0 c and 2 n items in the 2 nd sample with the corresponding acceptance number 2 2 c . If no failure occurs in the 1 st sample items put on test and the inequality ( 7) holds, we accept the lot. However, if the defects exist but less than or equal to 2, then the second sample will be considered. The probability of acceptance for the 1 st and 2 nd samples using Inverse Rayleigh is placed in Table 1. If there is difference between q t (the true unknown quartile lifetime) and that of the 0 q t (the specified quartile lifetime) of the product, it can be obtained by probability of acceptance respectively. For the Inverse Rayleigh Distribution, the probability of acceptance (PA) is given by
| p | n1 | n2 | t/s | 2 | 4 | 6 | 8 |
|---|---|---|---|---|---|---|---|
| 0.75 | 11 | 15 | 1 | 0.1739 | 0.9860 | 0.9941 | 0.9995 |
| 9 | 12 | 1.25 | 0.1740 | 0.9927 | 0.9950 | 0.9996 | |
| 8 | 11 | 1.5 | 0.1269 | 0.9944 | 0.9956 | 0.9996 | |
| 8 | 10 | 1.75 | 0.0689 | 0.9958 | 0.9955 | 0.9996 | |
| 7 | 9 | 2 | 0.0460 | 0.9970 | 0.9961 | 0.9997 | |
| 6 | 8 | 2.25 | 0.0315 | 0.9979 | 0.9966 | 0.9997 | |
| 5 | 7 | 2.5 | 0.0227 | 0.9987 | 0.9972 | 0.9998 | |
| 5 | 7 | 3 | 0.0009 | 0.9987 | 0.9972 | 0.9998 | |
| 0.9 | n1 | n2 | t/s | 2 | 4 | 6 | 8 |
| 21 | 25 | 1 | 0.0210 | 0.9454 | 0.9909 | 0.9991 | |
| 17 | 19 | 1.25 | 0.0269 | 0.9732 | 0.9915 | 0.9992 | |
| 12 | 14 | 1.5 | 0.0419 | 0.9885 | 0.9935 | 0.9995 | |
| 9 | 10 | 1.75 | 0.0514 | 0.9958 | 0.9950 | 0.9996 | |
| 8 | 9 | 2 | 0.0307 | 0.9970 | 0.9955 | 0.9996 | |
| 5 | 7 | 2.25 | 0.0574 | 0.9987 | 0.9972 | 0.9998 | |
| 3 | 5 | 2.5 | 0.1063 | 0.9996 | 0.9983 | 0.9999 | |
| 2 | 5 | 3 | 0.0612 | 0.9996 | 0.9989 | 0.9999 | |
| 0.95 | n1 | n2 | t/s | 2 | 4 | 6 | 8 |
| 25 | 30 | 1 | 0.0072 | 0.9150 | 0.9907 | 0.9989 | |
| 18 | 22 | 1.25 | 0.0160 | 0.9605 | 0.9916 | 0.9992 | |
| 14 | 19 | 1.5 | 0.0158 | 0.9732 | 0.9930 | 0.9994 | |
| 10 | 12 | 1.75 | 0.0324 | 0.9927 | 0.9945 | 0.9995 | |
| 9 | 11 | 2 | 0.0176 | 0.9944 | 0.9950 | 0.9996 | |
| 5 | 10 | 2.25 | 0.0472 | 0.9958 | 0.9972 | 0.9998 | |
| 4 | 6 | 2.5 | 0.0493 | 0.9992 | 0.9977 | 0.9998 | |
| 3 | 5 | 3 | 0.0155 | 0.9996 | 0.9983 | 0.9999 | |
| 0.99 | n1 | n2 | t/s | 2 | 4 | 6 | 8 |
| 30 | 35 | 1 | 0.0022 | 0.8791 | 0.9906 | 0.9987 | |
| 22 | 27 | 1.25 | 0.0046 | 0.9340 | 0.9910 | 0.9990 | |
| 13 | 18 | 1.5 | 0.0219 | 0.9768 | 0.9934 | 0.9994 | |
| 10 | 15 | 1.75 | 0.0241 | 0.9860 | 0.9947 | 0.9995 | |
| 9 | 13 | 2 | 0.0147 | 0.9908 | 0.9951 | 0.9996 | |
| 5 | 10 | 2.25 | 0.0472 | 0.9958 | 0.9972 | 0.9998 | |
| 4 | 6 | 2.5 | 0.0493 | 0.9992 | 0.9977 | 0.9998 | |
| 3 | 5 | 3 | 0.0155 | 0.9996 | 0.9983 | 0.9999 |
Table text extracted from the original PDF; superscript letters are shown inline. The original table image is below.
View original table image
The producer's risk is the probability of rejecting the lot when 0 qq tt . The probability of acceptance for a DASP that is placed in Table 1 was computed using the following
The minimum values of n satisfying equation 10 were obtained for 1 = 0.75, 0.9, 0.95, 0.99 and 0 q t t 1.00, 1.25, 1.50, 1.75, 2.00, 2.25, 2.50. These choices are consistent with Gupta and Groll (1961) [9] , Kantam and Rosaiah (1998) [15] , Aslam (2007) and Rao (2015) [16] .
Comparison of proposed acceptance sampling
In this section, compare the acceptance sampling plans given by Rao et al., (2012) [16] with the proposed sampling plan. The real data set is given to illustrate the proposed acceptance sampling plans. Our data set is obtained from Ross (2004) it represents the lifetimes (in hours) of a sample of 40 transistors. As this data is not used by anybody as per as acceptance sampling is concerned, we need to test and see whether if it is reasonable enough to admit that it follows the inverse Rayleigh distribution. We used Kolmogorov-Smirnov (K-S) 1-sample test for the data and got the distances as 0.303 and 0.558 with corresponding p-value 0.998. Likewise the quantiles plots see Fig 1. This clearly shows that the data fits quite well in the inverse Rayleigh model. Ordered output of the data [1] Suppose the experimenter wishes to establish the true unknown 10 th percentile lifetime for the transistors to be at least 110 hours with confidence p* = 0.95 and the life test to be truncated at 110 hours, this lead to the ratio [16] the probability of acceptance was 0.0288 almost 10% success. As we all know, 10% in life saving is not small. One advantage of our plan is the probability of acceptance increases as the ratio percentile increases. In the proposed approach, we notice that in a sample of 40 lots there are only 3 failures present, therefore we accept the product with probability of acceptance 0.95. The most important thing to note here is our proposed plan is far more economical than the one compared.
Conclusion
The sampling plan based on the inverse Rayleigh percentiles developed by Rao et.al (2012) [16] was extended to double acceptance sampling for percentiles using the same distribution. We found the double acceptance sampling plans for various values of and the different experiment times assuming that the lifetime of a product follows the inverse Rayleigh distribution. The proposed plan yields the probability of acceptance that could reduce the risk of allowing the customer to accept the bad lot. The single sampling plan could have less chance to report a failure than our proposed plan; it could accept the lot of bad quality. This is to ensure that the acceptance sampling based on percentile is used when the interest is obtaining life quality of products that a specified time limit. Hence the proposed plan is more economical than the single sampling plan percentiles. Even though the difference is only 10%, but this is an excellent proportion in terms of life saving. It also put pressure to the producer to make sure his products are up to standard since the test requires high probability of acceptance before the decision is reached.
References
25 in the original paper- Aslam M. Double acceptance sampling based on truncated life test in Rayleigh distribution. European Journal of Scientific research. 2007; 17(4):605-610.
- Baklizi A. Acceptance sampling based on truncated life tests in the Pareto distribution of the second kind. Advances and Applications in Statistics. 2003; 3(1):33-48.
- Balakrishnan N, Leiva V, Lopez J. Acceptance sampling plans from truncated life tests based on the generalized BirnbaumSaunders distribution. Communications in Statistics-Simulation and Computation. 2007; 36:643-656.
- Epstein B. Truncated life tests in the exponential case. Annals of Mathematics and Statistics. 1954; 25:555-564.
- Fan G, China PR. Bayes Estimation for inverse Rayleigh Model under different loss functions. Research Journal of Applied Sci. Eng. Technol. 2015; 9(12):1115-1118.
- Fertig FW, Mann NR. Life-test sampling plans for two-parameter Weibull populations. Technometrics. 1980; 22(2):165-177.
- Goode HP, Kao JHK. Sampling plans based on the Weibull distribution. Proceedings of Seventh National Symposium on Reliability and Quality Control, Philadelphia. 1961, 24-40.
- Gupta SS. Life test sampling plans for normal and lognormal distribution. Technometrics. 1962; 4:151-175.
- Gupta SS, Groll PA. Gamma distribution in acceptance sampling based on life tests. Journal of the American Statistical Association. 1961; 56:942-970.
- Kantam RRL, Rosaiah K, Rao GS. Acceptance sampling based on life tests: Log-logistic models. Journal of Applied Statistics. 2001; 28(1):121-128.
- Kantam RRL, Rosaiah K. Half logistic distribution in acceptance sampling based on life tests. IAPQR Trans. 1998; 23(2):117-125.
- Lio YL, Tsai T-R, Wu S-J. Acceptance sampling plans from truncated life tests based on the Birnbaum-Saunders distribution for percentiles. Communications in Statistics -Simulation and Computation. 2010; 39:119-136.
- Mukherjee SP, Saran LK. Bivariate inverse Rayleigh distributions in reliability studies. Journal of Industrial Statist. Assoc. 1984; 22:23-31.
- Montgomery DC. Introduction to statistical quality control, 6 th ed. John Wiley & Sons, 2009.
- Rao GS, Kantam RRL, Rosaiah K, Reddy JP. Acceptance Sampling Plans for Percentiles based on the Inverse Rayleigh Distribution. Electron. J App. Stat. Anal. 2012; 5(2):164-177.
- Rao GS. An Economic Reliability Test Plan Based on Truncated Life Test for Marshall-Olkin Extended Weibull Distribution. International Journal of Mathematics and Computational Sci. 2012, 2015; 1(2):50-54.
- Rao GS, Ghitany ME, Kantam RRL. Acceptance sampling plans for Marshall-Olkin extended Lomax distribution. International Journal of App. Mathematics. 2008; 21:315-325.
- Rosaiah K, Kantam RRL. Acceptance sampling based on the inverse Rayleigh distribution. Economic Quality Control. 2005; 20(2):277-286.
- Sheldom M. Ross. Introduction to Probability and Statistics for Engineers and Scientist. 3 rd Edition. Page 49. Academic Press, 2004.
- Schilling EG, Neubauer DV. Acceptance sampling in quality control, 2 nd ed. Taylor and Francis group, CRC Press. NY, 2008.
- Seidel W. Is sampling by variables worse than sampling by attributes? A decision theoretic analysis and a new mixed strategy for inspecting individual lots. Sankhya. 2007; 59:96-107.
- Sobel M, Tischendrof JA. Acceptance sampling with sew life test objective. Proceedings of Fifth National Symposium on Reliability and Quality Control, Philadelphia. 1959, 108-118.
- Sudamani, Sutharani R. Designing double acceptance sampling plans based on truncated life test in Rayleigh distribution using minimum angle method. American Journal of Mathematics and Statistics. 2013; 3(4):227-236.
- Tsai T-R, Wu S-J. Acceptance sampling based on truncated life tests for generalized Rayleigh distribution. Journal of Applied Statistics. 2006; 33:595-600.
- Yan Ai-Jun, Aslam M, Azam A, Chi Hyuck J. Developing a variable repetitive group sampling plan based on coefficient of variation. J Industrial and Prod. Engr. Taylor & Francis. 2017; 35(5):1-8.
Cited by 2
From OpenAlex, OpenCitations and reference lists read by Scinovex
- Modified Sequential Probability Ratio Test Based on Truncated Life Tests on the Exponential Distribution Functions ↗
Ibrahim Sylvester, A. B. Zoramawa · Journal of Physical Mathematics & its Applications · 2023
Modified Sequential probability ratio test (MSPRT) technique helps to increase the reliability and speed of stabilization detection on the Non homogenous poison process (NHPP) with the maximum number of software faults to reduce error between the consumer risk and producer risk, with the time cumulative system of hours. Modified sequential probability ratio test can be used to reduce the average…
❝ 1PDF - Double Acceptance Sampling Plan for Odd Generalized Exponential Log-logistic Distribution Based on Truncated Life Test ↗
Sivakumar D.C.U., Srinivasa Rao Gadde, Kanaparthi Rosaiah, K. Kalyani · Digital Manufacturing Technology · 2023
According to the results of industrial research, product failure time is correlated with fatigue weakness, which is typically produced by repeated stress variations. A double acceptance sampling strategy was presented for shortened life tests where the lifespan of test products follows an odd generalized exponential log-logistic distribution (OGELLD), according to the findings of this study. The minimum sample sizes for…
❝ 0PDF