
Research article · 2017 · Full text
International Journal of Statistics and Applied MathematicsDetection of adulteration of coconut oil using Fourier transform infrared spectroscopy and chemometrics
Volume 2(6) · Pages 46–51
Research areasSpectroscopy and Chemometric AnalysesCoconut Research and ApplicationsEdible Oils Quality and Analysis
Abstract
Author-writtenVirgin coconut oil may be adulterated with cheaper oils, such as palm oil and mustard oil. The detection and quantification of virgin coconut oil adulteration with palm oil and mustard oil were monitored using Fourier transform infrared spectroscopy, combined with chemometrics of Principle component analysis, Hierarchical cluster analysis and Discriminant analysis of frequency regions of 4000-400cm-1. The principal component analysis, hierarchical cluster analysis and discriminant analysis using two principal components were able to classify virgin coconut oil and the same adulterated with palm oil and mustard oil.
Summary
Source-checkedPlain-language reading of the full paper, prepared with AI and checked against the text. Each point links to the authors' own words.
Why it matters
- Oil adulteration occurs when expensive oils are replaced with cheaper alternatives, either intentionally or by accident. View evidence ↗
- Detecting adulteration is difficult when the additive has a chemical composition similar to the original oil. View evidence ↗
- Traditional detection methods like chromatography and wet chemistry are laborious and slow, creating a need for faster, more sensitive alternatives. View evidence ↗
The question
- The study aims to use FTIR spectroscopy and chemometric tools (PCA, HCA, and discriminant analysis) to quantify and classify the adulteration of coconut oil with palm and mustard oils. View evidence ↗
What they did
- Virgin coconut oil was blended with palm oil and mustard oil at concentrations of 5%, 10%, and 15% v/v. View evidence ↗
- Samples were analyzed via FTIR spectroscopy, and specific spectral regions showing variation between pure and adulterated oils were used for chemometric analysis. View evidence ↗
- The researchers used SPSS version 17.0 to perform Principal Component Analysis (PCA), Hierarchical Cluster Analysis (HCA), and Discriminant Analysis. View evidence ↗
What they found
- The data was found to be adequate for factor analysis, with a Kaiser-Meyer-Olkin (KMO) measure of 0.805 and a Bartlett's value of 2066 (p=0.000). View evidence ↗
- PCA revealed that two principal components could explain 99.73% of the total variance, with the first accounting for 89.55% and the second for 10.18%. View evidence ↗
- Factor 1 grouped virgin coconut oil together with palm oil adulterants at 5%, 10%, and 15% levels, all showing a loading value of 0.963. View evidence ↗
- Factor 2 specifically grouped the mustard oil adulterants (5% at 0.372; 10% and 15% at 0.375), separating them from the palm oil group. View evidence ↗
- HCA results indicated that mustard oil adulteration is easily identified, while palm oil adulteration (specifically at 10%) is difficult to distinguish from pure coconut oil. View evidence ↗
- The dendrogram identified two natural groupings: Cluster A containing all mustard oil blends and Cluster B containing virgin coconut oil and all palm oil blends. View evidence ↗
- Discriminant analysis correctly classified 36.5% of original cases and 7.7% of cross-validated cases. View evidence ↗
What it means
- The authors conclude that combining FTIR spectroscopy with multivariate chemometrics is an effective, fast, and reliable strategy for detecting palm and mustard oil adulteration in virgin coconut oil. View evidence ↗
- The authors recommend that food organizations implement more reliable detection methods to ensure the purity of edible oils for consumers. View evidence ↗
Visual summary
3 visualsIllustrations explain the paper; charts are replotted from the paper's own table values.

Adulterant Grouping Concept
AI-generated conceptual illustration (coconut oil, palm oil, and mustard oil in glass vials). It explains the idea and does not show study data.
View source evidence ↗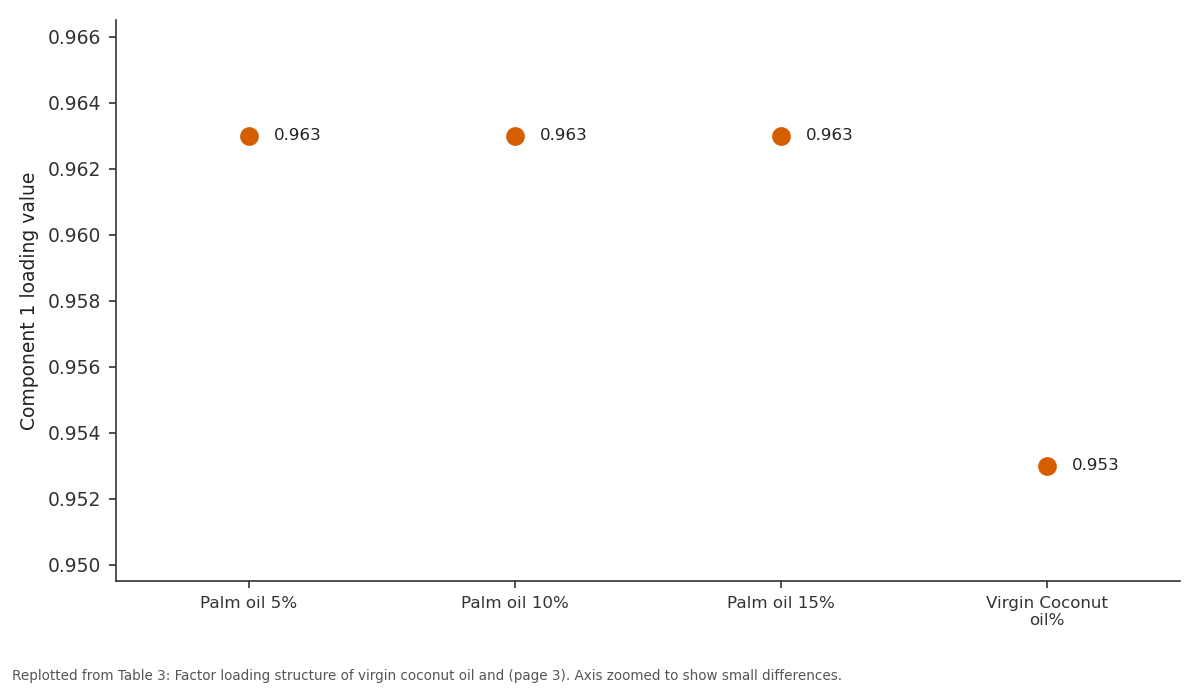
Component: Palm oil 5% vs Palm oil 10% vs Palm oil 15% vs Virgin Coconut oil%
Replotted from Table 3 (page 3) of the original paper. Every bar is the paper's own table value.
View source evidence ↗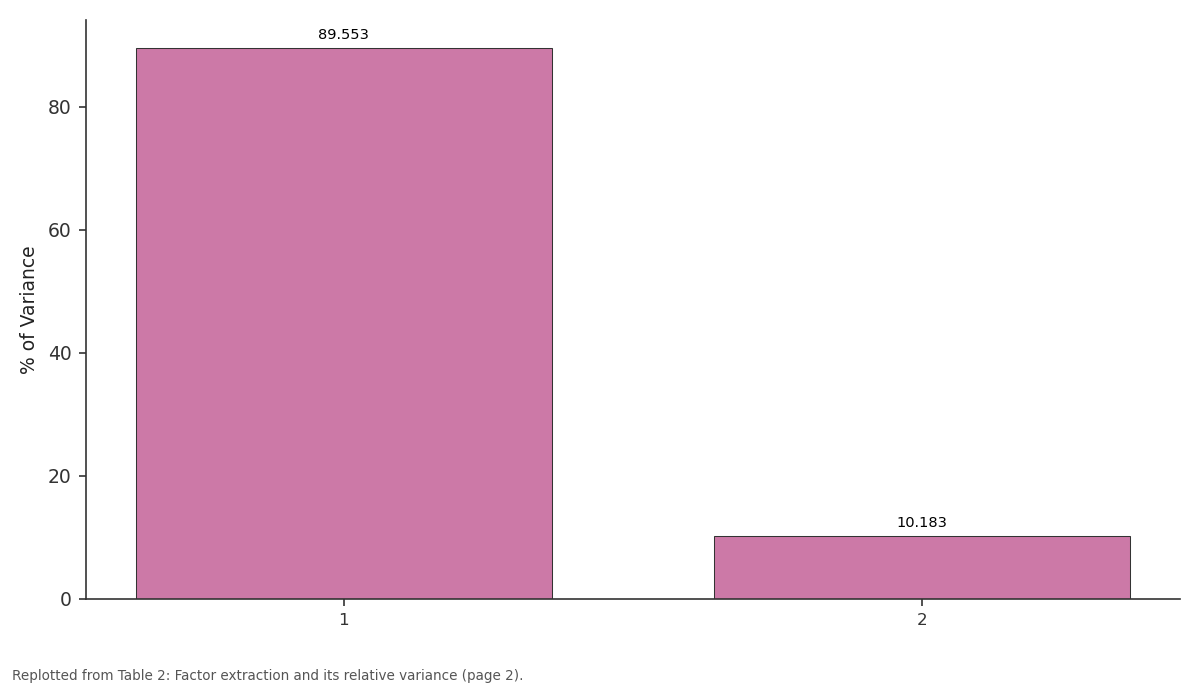
% of Variance: 1 vs 2
Replotted from Table 2 (page 2) of the original paper. Every bar is the paper's own table value.
View source evidence ↗Figures & tables
From the original paper Table 1
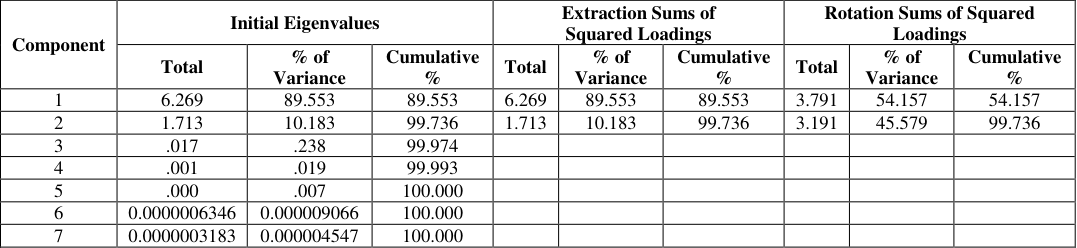 Table 2
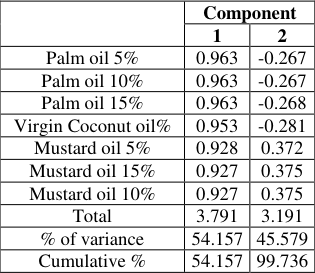 Table 3
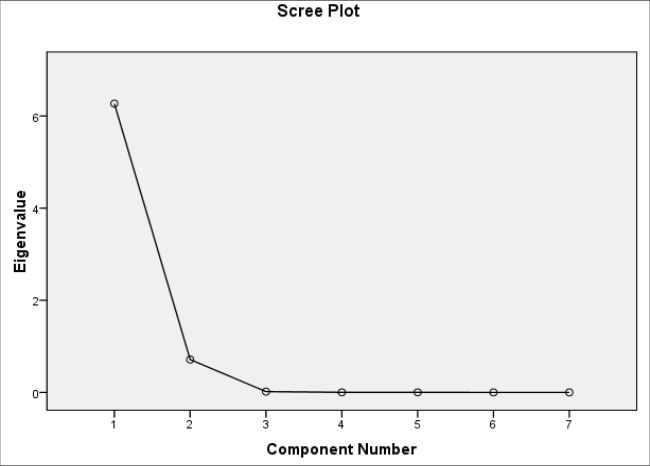 Figure 1
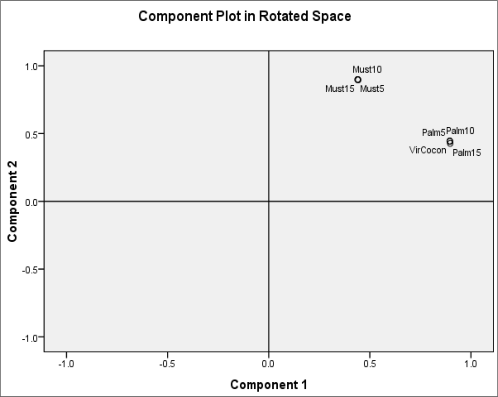 Figure 2
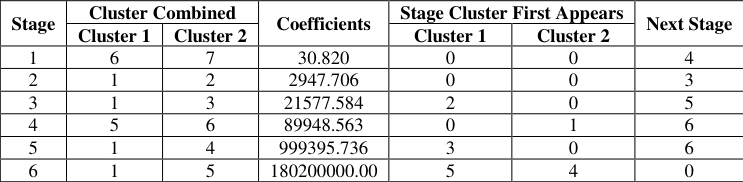 Table 4
 Table 5
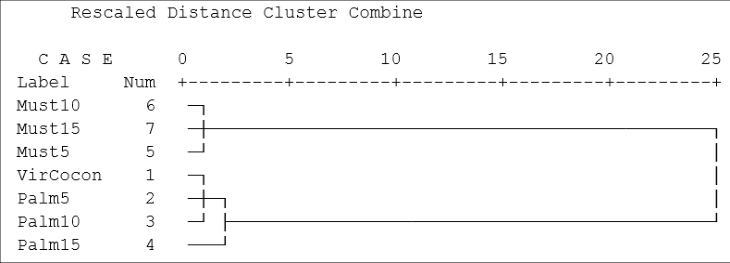 Figure 3
 Table 6
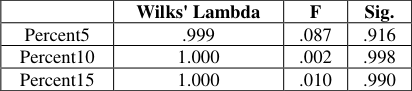 Table 9
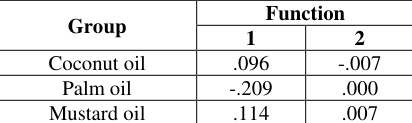 Table 10
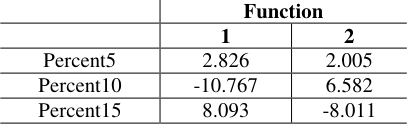 Table 7
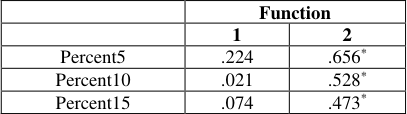 Table 8
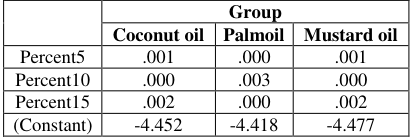 Table 11
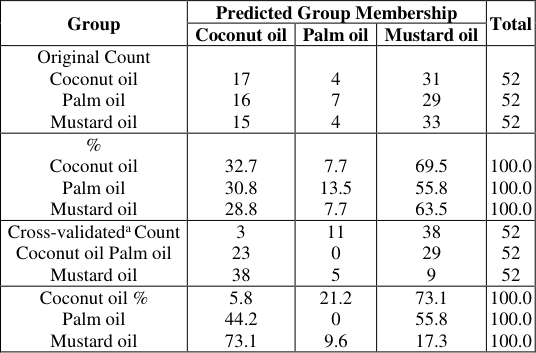 Table 12
Introduction
The adulteration is sometimes acted deliberately and sometimes accidentally (Shukla et al., 2005) [10] which involves the replacement of high price oils with cheaper ones. The adulteration of fats and oils is not easy to detect when the oil adulterant has a composition approaching to that of the original oil (Rossell et al., 1983) [9] . Most initial researches conducted to analyze the oil adulterant, involved time consuming and laborious processes such as wet chemical methods and chromatography techniques. Therefore, there is a demand to develop rapid and sensitive method for detecting and quantifying the adulterants. Fourier transform infrared (FTIR) spectroscopy combined with chemometric tools has received a great attention to be used in the quantitative analysis and to analyze virgin oils in the mixture with other edible oils (Che Man and Mirghani, 2001). In the case of studies of authentication, FTIR combined with chemometrics has been explored to detect adulterants such as lard in cod-liver oil (Rohman and Che Man, 2009a) [7] , palm oil (Rohman and Che Man, 2009b) [8] , and palm kernel oil (Manaf et al., 2007) [6] in virgin coconut oil, sunflower, corn, soybean, and hazelnut oils (Lerma et al., 2010) [5] , corn oil (Gurdeniz and Ozen, 2009) [3] , and sunflower oil (Downey et al., 2002) [2] in extra virgin olive oil (EVOO), soybean oil in camellia oil (Wang et al., 2006) [12] , and some vegetable oils in olive oil (Tay et al., 2002) [11] . Therefore, this study is directed to analyze the deduction of the adulteration of coconut oil with palm oil and mustard oil using chemometrics of principal component analysis, hierarchical cluster analysis and discriminant analysis for quantification and classification.
Materials and Methods
Materials and Methods
Sample Preparation
Vegetable oils, such as virgin coconut oil, palm oil and mustard oil were purchased from the local market. The virgin coconut oil was mixed with palm oil and mustard oil in different proportions i.e., 5, 10 and 15% v/v in the neat forms. To complete the homogenization, these mixtures were shaken vigorously. All samples were analyzed using an FTIR spectrometer. The spectral regions where the variations were observed between the virgin coconut oil and the same adulterated with palm oil and mustard oil were chosen for developing the chemometric tools.
Statistical analysis
For each adulterant a different set of samples containing three concentration levels of adulterant, were used for calibration; the corresponding admixtures were used for validation. Principal Component Analysis, Hierarchical Cluster Analysis and Discriminant Analysis were used for each blend with the respective training set samples by using the SPSS version 17.0.
Principal Component Analysis
Before proceeding with the factor analysis of the present data, the adequacy test was applied. The rule of thumb, index, provided by the Kaiser measure of sampling adequacy was applied to acquire a rough idea of whether the data are adequate for the technique or not. The following table.1 provides the KMO index for the virgin coconut oil with adulterants of palm oil and mustard oil. The KMO measure indicates the marvelous level of coconut oil adulterant (0.805) and Barlett's value of 2066 with a significance of 0.000. Hence, the factor analysis was carried out further to differentiate against adulterants. The first factor (component) accounts for 89.55% of the total variance and the second factor accounts for 10.18% of the variance. Hence, the total variance explained by these two factors accounts for 99.73%. So only a meager 0.264% of variance was not explained with the remaining components.
In order to confirm the initial factors extracted in the principal component analysis, the rotation was carried out using VARIMAX rotation. After the initial factor extraction, the varimax rotation was carried out and the results show that, even in this face, only two component models were exhibited with an eigenvalue of 3.791 and 3.191 with the percentage of variance of 54.15% for the first component and 45.57% for the second component (Table .2). Hence, the total variance explained by these two component accounts for 99.73%.
Therefore, it can be stated that using principal component analysis, the variables of spectral data can be described by the principal components because the first two principal components can describe more than 90% of the variation. The scree plot (Fig. 1) indicates clear identification of only two components. It can be concluded that FTIR spectral data in combination with chemometrics of principal component analysis can be exploited for differentiation and classification of virgin coconut oil from their adulterants. From the scatter points, the samples could be classified into two groups, indicating a clear differentiation between adulterations blended with virgin coconut oil at different proportions. After identifying the number of factors, the variables included in each factor are distinguished. The factor loadings are considered as the best measure to include variables into factors. The factor loading is considered to be the best method associated with a specific factor and a specific state and it is simply the correlation between the factor and the statement's standardized score. The table shows the factor loading on the 7 variables (Table . 3). The factor -matrix pattern reflects a reasonably clear loading structure. Reference groups can be very potent and influential. In the present study, the samples of virgin coconut oil adulterated with palm oil 15% (with a loading value 0.963), palm oil 10% (with a loading value 0.963) and palm oil 5% (with a loading value 0.963) and the virgin coconut oil are associated and form into factor 1. In the second component, adulterants of virgin coconut oil with mustard oil 15% (with a loading value 0.375), mustard oil 10% (with a loading value 0.375 and mustard oil 5% (with a loading value 0.372) are grouped into factor 2 (Table .3). This clearly indicates that in the case of coconut oil, the FTIR spectral data of the palm oil adulterants did not show any significant difference, whereas, the mustard oil adulterants of 5, 10 and 15% with the coconut oil will not come closer to the earlier factor.
The factor matrix pattern also reflects the reasonable clear loading structure which is given in Fig. 2. Two factor exhibits combining virgin coconut oil and palm oil of different percentage as an isolated factor. These coefficients depend on the method which is chosen for forming the cluster. The graphical presentation of the hierarchical clustering results (Fig. 3) can be represented in the form of a dendrogram, where two clusters can be identified. Since the distance is very close, only two major visible clusters are formed which were termed as cluster A and cluster B.
The hierarchical cluster analysis, at the distance of oils can be grouped as follows:
Cluster A comprises of mustard oil 10%, mustard oil 15% and mustard oil 5% Cluster B comprises of virgin coconut oil, palm oil 5%, palm oil 10% and palm oil 15%.
The dendrogram shows that the samples of palm oil 15% clustered with palm oil 10% forms into a homogenous cluster.
At the second cluster level, the virgin coconut oil is clustered with palm oil 5% level and the other clusters are with the long distance (Fig. 3). The dendrogram shows that the virgin coconut oil is quite homogeneous. From the above results it is clear that mustard oil used as an adulterant with the coconut oil can easily be identified, whereas palm oil by 10% adulterated with the coconut oil is very difficult to identify. Detection of such natural groupings suggests that discrimination between at least some of them may be possible. Hence, blending of palm oil with coconut oil as an adulterant is hard to find with the help of the spectral data.
Dendrogram using Single Linkage
Dendrogram using Single Linkage
Discriminant analysis
The edible oil variable is independent of the study that comprises of two factors, namely virgin coconut oil and adulterants namely palm oil and mustard oil. From this output; we can see that virgin coconut oil, palm oil and mustard oil differ noticeably from group to group. One attribute of edible oil construct representing the virgin coconut oil. Meanwhile the adulterants contain three attributes as follows; palm oil consists of three attributes, namely palm oil 5%, palm oil 10% and palm oil 15% in proportion and the mustard oil consist of three attributes, namely mustard oil 5%, mustard oil 10% and mustard oil 15% in different proportion.
The dependent variable for the present study is the adulterant which consists of three categories 5%, 10% and 15% in different proportions.
In order to determine whether the edible oils are capable for subsequent analysis, the results of the present study based on Multiple Discriminant analysis on edible oil are discussed below.
Conclusion
The present study reveals that the FTIR spectroscopy, in combination with the multivariate chemometric methods, represents an effective strategy for fast and reliable identification and detecting adulteration of virgin coconut oil with palm oil and mustard oil as a potential adulterant. Chemometrics combined with FT-IR spectroscopy proved to be an excellent method for quality control of coconut oil and identifying substances by providing unique fingerprint spectra in classifying oils and detecting adulteration of palm oil and mustard oil. The results of the present study, which concluded with the detection of oils using FTIR spectral data and chemometric analysis indicates a necessity for food related organizations to develop and utilize more reliable methods to detect such adulterations, which can make consumers and markets more certain on the authenticity and purity of edible oils.
Figures and tables from the paper
| Kaiser-Meyer-Olkin Measure of Sampling Adequacy | 0.805 |
|---|---|
| Bartlett's Test of Sphericity Approx. Chi-Square | 2066.00 |
| df | 21 |
| Sig. | 0.000 |
Table text extracted from the original PDF; superscript letters are shown inline. The original table image is below.
View original table image
| — | Component | — |
|---|---|---|
| 1 | 2 | |
| Palm oil 5% | 0.963 | -0.267 |
| Palm oil 10% | 0.963 | -0.267 |
| Palm oil 15% | 0.963 | -0.268 |
| Virgin Coconut oil% | 0.953 | -0.281 |
| Mustard oil 5% | 0.928 | 0.372 |
| Mustard oil 15% | 0.927 | 0.375 |
| Mustard oil 10% | 0.927 | 0.375 |
| Total | 3.791 | 3.191 |
| % of variance | 54.157 | 45.579 |
| Cumulative % | 54.157 | 99.736 |
Table text extracted from the original PDF; superscript letters are shown inline. The original table image is below.
View original table image
| Stage | Cluster Combined | — | Coefficients | Stage Cluster First Appears | — | Next Stage |
|---|---|---|---|---|---|---|
| Cluster 1 | Cluster 2 | Cluster 1 | Cluster 2 | |||
| 1 | 6 | 7 | 30.820 | 0 | 0 | 4 |
| 2 | 1 | 2 | 2947.706 | 0 | 0 | 3 |
| 3 | 1 | 3 | 21577.584 | 2 | 0 | 5 |
| 4 | 5 | 6 | 89948.563 | 0 | 1 | 6 |
| 5 | 1 | 4 | 999395.736 | 3 | 0 | 6 |
| 6 | 1 | 5 | 180200000.00 | 5 | 4 | 0 |
Table text extracted from the original PDF; superscript letters are shown inline. The original table image is below.
View original table image
| Group | — | Mean | Std. Deviation | Valid N (list wise) | — |
|---|---|---|---|---|---|
| Unweighted | Weighted | ||||
| Coconut | Percent5 | 2582.57 | 997.104 | 52 | 52.000 |
| Percent10 | 2582.57 | 997.104 | 52 | 52.000 | |
| Percent15 | 2582.57 | 997.104 | 52 | 52.000 | |
| Palm | Percent5 | 2517.91 | 1052.561 | 52 | 52.000 |
| Percent10 | 2580.15 | 996.445 | 52 | 52.000 | |
| Percent15 | 2563.79 | 989.259 | 52 | 52.000 | |
| Mustard | Percent5 | 2596.32 | 1014.750 | 52 | 52.000 |
| Percent10 | 2590.51 | 1011.476 | 52 | 52.000 | |
| Percent15 | 2590.66 | 1011.647 | 52 | 52.000 | |
| Total | Percent5 | 2565.60 | 1015.700 | 156 | 156.000 |
| Percent10 | 2584.41 | 995.225 | 156 | 156.000 | |
| Percent15 | 2579.01 | 992.975 | 156 | 156.000 |
Table text extracted from the original PDF; superscript letters are shown inline. The original table image is below.
View original table image
| Function | Eigenvalue | % of Variance | Cumulative % | Canonical Correlation | Wilks' Lambda | Chi-square | df | Sig. |
|---|---|---|---|---|---|---|---|---|
| 1 | .022a | 99.8 | 99.8 | .148 | .978 | 3.373 | 6 | .761 |
| 2 | .000a | .2 | 100.0 | .006 | 1.000 | .005 | 2 | .997 |
Table text extracted from the original PDF; superscript letters are shown inline. The original table image is below.
View original table image
| — | Wilks' Lambda | F | Sig. |
|---|---|---|---|
| Percent5 | .999 | .087 | .916 |
| Percent10 | 1.000 | .002 | .998 |
| Percent15 | 1.000 | .010 | .990 |
Table text extracted from the original PDF; superscript letters are shown inline. The original table image is below.
View original table image
| Group | Function | — |
|---|---|---|
| 1 | 2 | |
| Coconut oil | .096 | -.007 |
| Palm oil | -.209 | .000 |
| Mustard oil | .114 | .007 |
Table text extracted from the original PDF; superscript letters are shown inline. The original table image is below.
View original table image
| — | Function | — |
|---|---|---|
| 1 | 2 | |
| Percent5 | 2.826 | 2.005 |
| Percent10 | -10.767 | 6.582 |
| Percent15 | 8.093 | -8.011 |
Table text extracted from the original PDF; superscript letters are shown inline. The original table image is below.
View original table image
| — | Function | — |
|---|---|---|
| 1 | 2 | |
| Percent5 | .224 | .656* |
| Percent10 | .021 | .528* |
| Percent15 | .074 | .473* |
Table text extracted from the original PDF; superscript letters are shown inline. The original table image is below.
View original table image
| — | Group | — | — |
|---|---|---|---|
| Coconut oil | Palmoil | Mustard oil | |
| Percent5 | .001 | .000 | .001 |
| Percent10 | .000 | .003 | .000 |
| Percent15 | .002 | .000 | .002 |
| (Constant) | -4.452 | -4.418 | -4.477 |
Table text extracted from the original PDF; superscript letters are shown inline. The original table image is below.
View original table image
References
10 in the original paper- Che Man YB, Syahariza ZA, Mirghani MES, Jinap S, Bakar J. Analysis of potential lard adulteration in chocolate and chocolate products using Fourier transform infrared spectroscopy. Food Chemistry. 2005; 90:815819.
- Downey G, Mc Intyre P, Davies AN. Detecting and quantifying sunflower oil adulteration in extra virgin olive oils from the eastern Mediterranean by visible and near-infrared spectroscopy. Journal of Agricultural and Food Chemistry. 2002; 50:5520-5525.
- Gurdeniz G, Ozen B. Detection of adulteration of extravirgin olive oil by chemometric analysis of midinfrared spectral data. Food Chemistry. 2009; 116:519-525.
- Hair J, Anderso RE, Tatham RL, Black WC. Multivariate Data Analysis, Fifth ed., Prentice Hall, New Jersey, 1998.
- Lerma-Garcia MJ, Ramis-Ramos G, Herrero-Martinez JM, Simo-Alfonso EF. Authentication of extra virgin olive oils by Fourier transform infrared spectroscopy. Food Chemistry. 2010; 118:78-83.
- Manaf MA, Che Man YB, Hamid NSA, Ismail A, Syahariza ZA. Analysis of adulteration of virgin coconut oil by palm kernel olein using Fourier transform infrared spectroscopy. Journal of Food Lipids. 2007; 14:111-121.
- Rossell JB, King B, Downes MJ. Detection of adulteration. Journal of the American Oil Chemists' Society. 1983; 60:333-339.
- Shukla AK, Dixit AK, Singh RP. Detection of adulteration in edible oils. Journal of Oleo Science. 2005; 6:317-324.
- Tay A, Singh RK, Krishnan SS, Gore JP. Authentication of olive oil adulterated with vegetable oils using Fourier transform infrared spectroscopy. LWT Food Science and Technology. 2002; 35:99-103.
- Wang L, Lee FSC, Wang X, He Y. Feasibility study of quantifying and discriminating soybean oil adulteration in camellia oils by attenuated total reflectance MIR and fiber optic diffuse reflectance NIR. Food Chemistry. 2006; 95:529-536.
Cited by 13
From OpenAlex, OpenCitations and reference lists read by Scinovex
- Advanced process analytical tools for identification of adulterants in edible oils – A review ↗
E.J. Rifna, Ravi Pandiselvam, Anjineyulu Kothakota, K.V. Subba Rao, Madhuresh Dwivedi, Manoj Kumar et al. · Food Chemistry · 2021
❝ 93 - Recent Advancements on Vibrational Spectroscopic Techniques for the Detection of Authenticity and Adulteration in Horticultural Products with a Specific Focus on Oils, Juices and Powders ↗
Ebrahiema Arendse, Helene H. Nieuwoudt, Lembe Samukelo Magwaza, Jean Frederic Isingizwe Nturambirwe, Olaniyi Amos Fawole, Umezuruike Linus Opara · Food and Bioprocess Technology · 2020
❝ 64 - Rapid and non-destructive approach for the detection of fried mustard oil adulteration in pure mustard oil via ATR-FTIR spectroscopy-chemometrics ↗
Rahul Jamwal, Amit, Shivani Kumari, Biji Balan, Simon Douglas Kelly, Andrew Cannavan et al. · Spectrochimica Acta Part A Molecular and Biomolecular Spectroscopy · 2020
❝ 54 - Analytical approaches for the determination of adulterated animal fats and vegetable oils in food and non-food samples ↗
Nayab Kanwal, Syed Ghulam Musharraf · Food Chemistry · 2024
❝ 44 - Utilizing ATR-FTIR spectroscopy combined with multivariate chemometric modelling for the swift detection of mustard oil adulteration in virgin coconut oil ↗
Amit, Rahul Jamwal, Shivani Kumari, Amit Singh Dhaulaniya, Biji Balan, Simon Douglas Kelly et al. · Vibrational Spectroscopy · 2020
❝ 35 - Use of FTIR spectroscopy integrated with multivariate chemometrics as a swift, and non-destructive technique to detect various adulterants in virgin coconut oil: A comprehensive review ↗
Amit, Shivani Kumari, Rahul Jamwal · Food Chemistry Advances · 2023
Virgin coconut oil (VCO) has of late come out as one of the most treasured edible oils as it has many functions as a crucial component used in food preparation, pharmacy, and cosmetic merchandise. These quality parameters have placed VCO in high consumption need, and the chances of its adulteration have significantly surged. Therefore, adulteration determination is the most demanding…
❝ 20PDF - Detection and quantification of palmolein and palm kernel oil added as adulterant in coconut oil based on triacylglycerol profile ↗
Akhil Chandrakanth Komaram, Enti Anjaneyulu, Karabi Goswami, Rati Ranjan Nayak, Sanjit Kanjilal · Journal of Food Science and Technology · 2021
❝ 20PDF - Swift and precise detection of argemone oil adulteration in virgin coconut oil by implementing ATR-FTIR spectroscopy integrated with multivariate chemometrics and regression modelling ↗
Shivani Kumari, Amit, Dileep Kumar Singh · Vibrational Spectroscopy · 2023
❝ 19PDF - Multivariate Curve Resolution Methodology Applied to the ATR-FTIR Data for Adulteration Assessment of Virgin Coconut Oil ↗
Michele De Luca, Giuseppina Ioele, Fedora Grande, Maria Antonietta Occhiuzzi, Martina Chieffallo, Antonio Garofalo et al. · Molecules · 2023
Virgin coconut oil (VCO) is a functional food with important health benefits. Its economic interest encourages fraudsters to deliberately adulterate VCO with cheap and low-quality vegetable oils for financial gain, causing health and safety problems for consumers. In this context, there is an urgent need for rapid, accurate, and precise analytical techniques to detect VCO adulteration. In this study, the…
❝ 12PDF - Expeditious and accurate detection of palm oil adulteration in virgin coconut oil by utilizing ATR-FTIR spectroscopy along with chemometrics and regression models ↗
Amit, Shivani Kumari, Rahul Jamwal, Pooja Suman, Dileep Kumar Singh · Food Chemistry Advances · 2023
Virgin coconut oil (VCO), being one of the most treasured and healthy edible oil, is at great risk of blending with cheaper oils like palm oil (PO). Fourier transform infrared (FTIR) spectroscopy with an Attenuated total reflection (ATR) accessory was used together with multivariate chemometrics for the classification and evaluation of numerous concentrations of PO (0.5-30% v/v) in VCO. Linear…
❝ 7PDF - HPTLC PROFILING AND FTIR FINGERPRINTING COUPLED WITH CHEMOMETRIC ANALYSIS OF MALAYSIAN STINGLESS BEE PROPOLIS ↗
Ainur Awanis Mohd Badiazaman, Khamsah Suryati Mohd, Nur Basyirah Md Zin, Habsah Mohamad, Ahmad Nazif Aziz · Jurnal Teknologi · 2023
Propolis is a natural substance produced by the bees to protect their hive. The present work reports the utilization of chemical profiling and fingerprinting combined with multivariate analysis for discrimination of the geographical origin of Malaysian stingless bee propolis. High Performance Thin Layer Chromatography (HPTLC) has been performed to profile the chemical composition of Geniotrigona thoracica propolis from different localities…
❝ 5PDF - Food Quality Standards and Importance of Authentication of Coconut Products ↗
M. Anjaly Shanker, Anandu Chandra Khanashyam, Priyamvada Thorakkattu, Zuraidah Nasution, Ravi Pandiselvam · Springer eBooks · 2024
❝ 2 - Benchmarking analytical parameters for the aging and adulteration of coconut oil ↗
H. G. T. H. Jayatunga, H.D. Weeratunge, H.P.P.S. Somasiri, Kariyawasam R. R. Mahanama · Microchemical Journal · 2025
❝ 0