
Research article · 2026 · Full text
International Journal of Agriculture Extension and Social DevelopmentImpact of Tasar culture on the livelihood of farmers in Saraikela-Kharsawan District of Jharkhand
Volume 9(8) · Pages 18–25 · DOI: 10.33545/26180723.2026.v9.i8a.3980 ↗
Research areasForest Ecology and ConservationSilkworms and Sericulture ResearchSocial and Economic Development in India
Abstract
Author-writtenThe present investigation examined how tasar rearing shapes the livelihood of cultivators in the Saraikela-Kharsawan district of Jharkhand, with fieldwork carried out across the Kuchai and Kharsawan blocks. A total of sixty tasar-rearing households were drawn through a multi-stage random sampling design, and first-hand information was gathered using structured interview schedules. The responses were summarised with simple descriptive measures, namely frequencies, percentages and average ranking. In the study area, tasar rearing operates as a forest-linked enterprise that remains commercially appealing to rural households. Tribal families have long pursued the activity both within natural forest tracts and around their homesteads. Most of the sampled cultivators belonged to Scheduled Tribe communities, fell within the younger and middle-aged brackets, and had schooling that generally did not exceed the middle-school stage. The full package of recommended tasar practices was not taken up uniformly; even so, selected interventions such as rearing on economic plantations, pruning, guarding against leaf gall and brushing by leaf-twig transfer were adopted either wholly or in part. Participation in tasar work was associated with visible gains in the skills, earnings and employment of the respondents. Yearly income attributable to the activity ranged between roughly Rs. 25,000 and Rs. 1,00,000, and the enterprise generated between 50 and 125 mandays of work. Every respondent reported improved food intake, while 98.00 per cent noted better housing, 75.00 per cent better education, 73.33 per cent better clothing and 23.33 per cent improved access to transport. The activity nevertheless remained exposed to erratic weather, pest and disease outbreaks, shortfalls in the supply of disease-free layings (DFLs) and thin technical support. Strengthening farmer awareness of recommended practices through ICT platforms and a range of extension approaches is therefore recommended.
Summary
Source-checkedPlain-language reading of the full paper, prepared with AI and checked against the text. Each point links to the authors' own words.
Why it matters
- Sericulture is a labor-intensive but commercially rewarding small-scale economic activity that is well-suited for village-based cultivators. View evidence ↗
- Jharkhand is a leader in tasar silk production in India, contributing 76.40% of the total national output. View evidence ↗
- Tasar production is a promising supplementary livelihood for rural and tribal populations because it is based on both forests and agriculture. View evidence ↗
What they did
- The research was conducted in the Saraikela-Kharsawan district of Jharkhand, selected because it has the largest area dedicated to tasar farming. View evidence ↗
- A total of 60 cultivators were sampled using a multi-stage random design across two blocks (Kuchai and Kharsawan) and six villages. View evidence ↗
What they found
- The majority of the sampled farmers (88%) belonged to Scheduled Tribe communities. View evidence ↗
- Tasar rearing was the primary source of income for the respondents, accounting for 40% of their total income. View evidence ↗
- Annual income from tasar culture varied, with 73% of respondents earning up to Rs. 25,000 and a small fraction (2%) earning between Rs. 75,001 and Rs. 1,00,000. View evidence ↗
- Tasar culture generated significant employment, with 40% of respondents recording 76–100 mandays of work. View evidence ↗
- Several improved practices were adopted by 100% of the farmers, including rearing on economic plantations, leaf gall prevention, and sodium hypochlorite spray. View evidence ↗
- No respondents (0%) adopted protected chawki rearing under nylon nets, leaving crops more vulnerable to pests. View evidence ↗
- The most significant constraint faced by farmers was attacks by predators and pests, reported as a major issue by 93.33% of respondents. View evidence ↗
- Climatic disturbances were the second most pressing constraint, affecting 28.33% of respondents to a great extent. View evidence ↗
What it means
- The authors conclude that tasar farming provides a productive livelihood for the farming communities in the Kuchai and Kharsawan blocks. View evidence ↗
- The authors recommend using mass media and ICT tools to familiarize farmers with improved technologies and market-driven practices. View evidence ↗
Visual summary
2 visualsIllustrations explain the paper; charts are replotted from the paper's own table values.
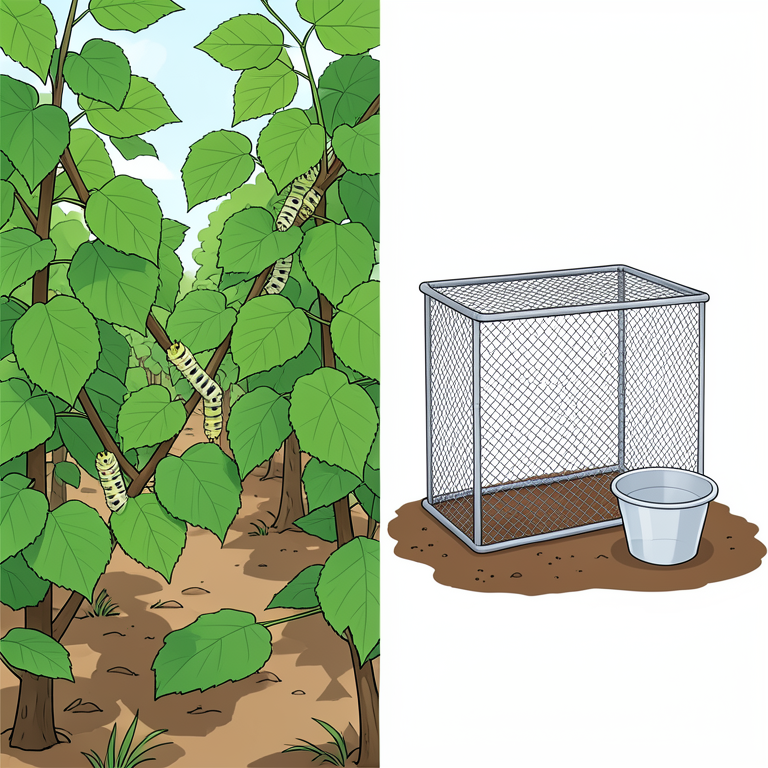
Technology Adoption Spectrum
AI-generated conceptual illustration (Tasar silkworms and mulberry trees). It explains the idea and does not show study data.
View source evidence ↗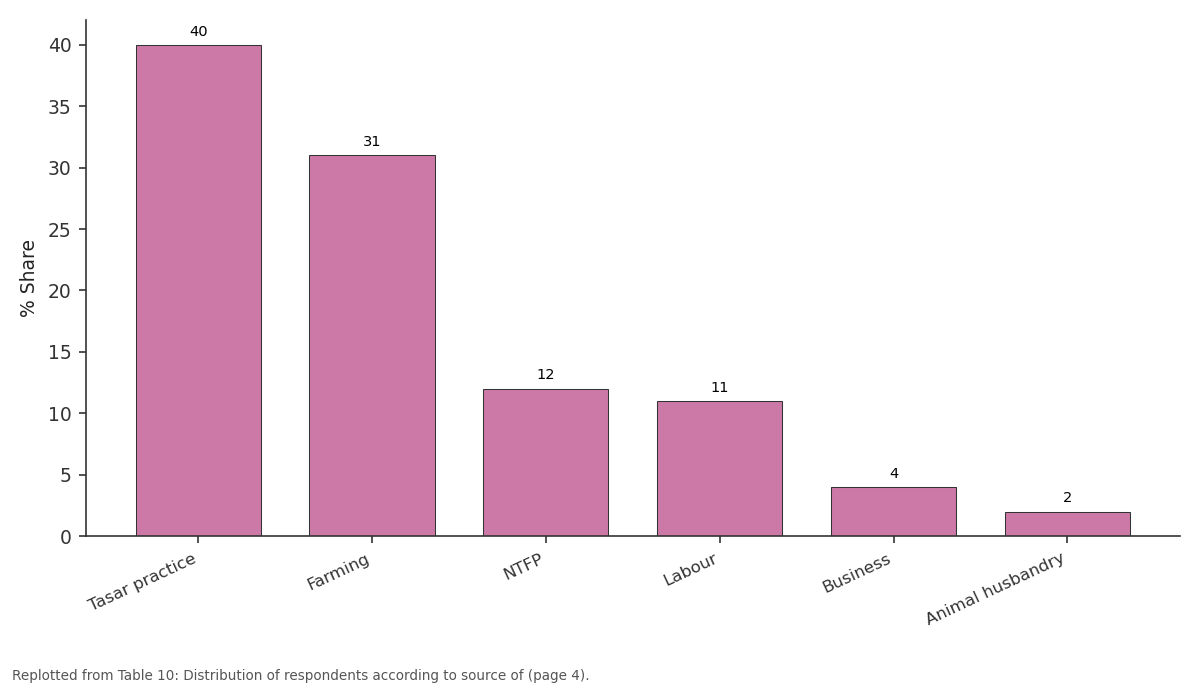
% Share: Tasar practice vs Farming vs NTFP vs Labour vs Business
Replotted from Table 10 (page 4) of the original paper. Every bar is the paper's own table value.
View source evidence ↗Figures & tables
From the original paper Table 1
 Table 4
 Table 2
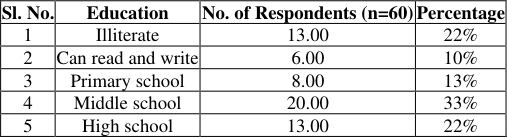 Table 5
 Table 3
 Table 6
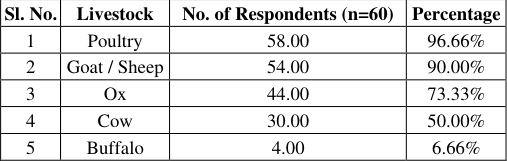 Table 9
 Table 7
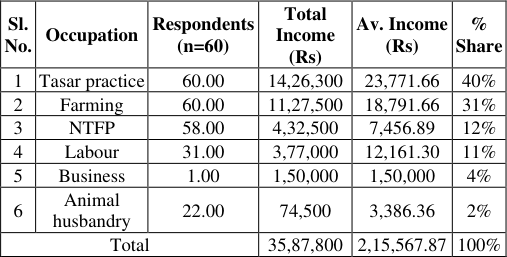 Table 10
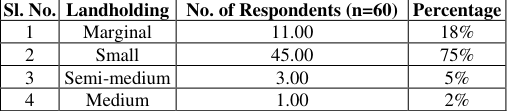 Table 8
 Table 11
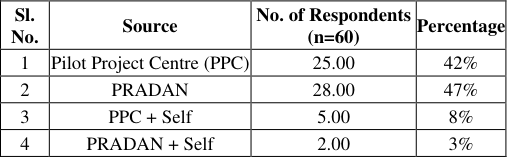 Table 12
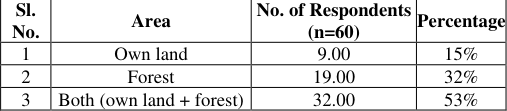 Table 13
 Table 15
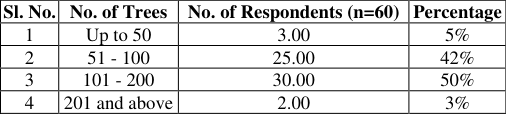 Table 14
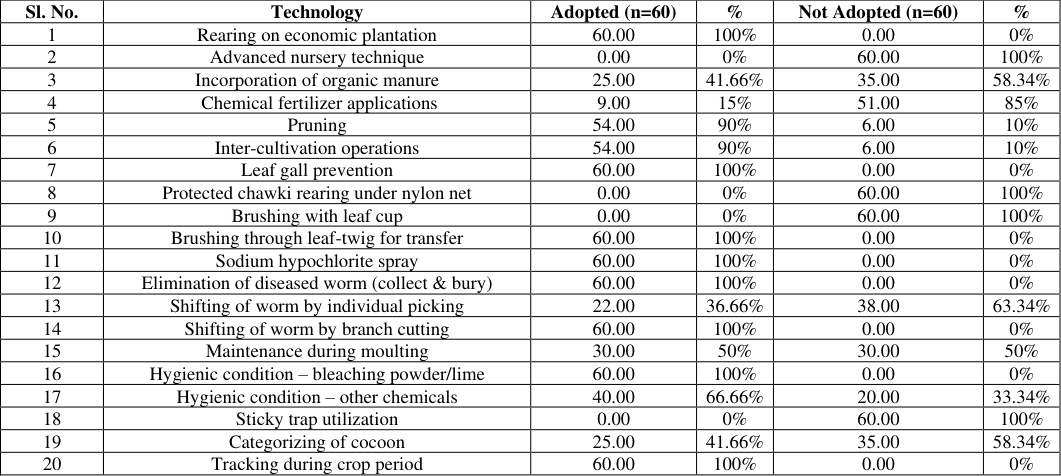 Table 16
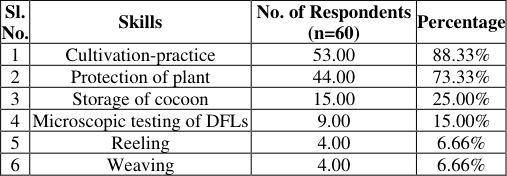 Table 17
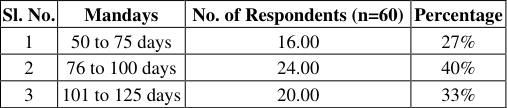 Table 18
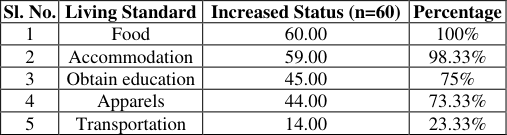 Table 20
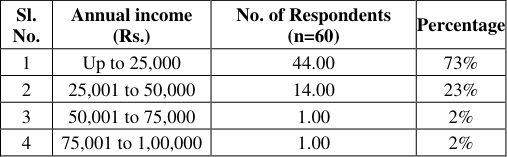 Table 19
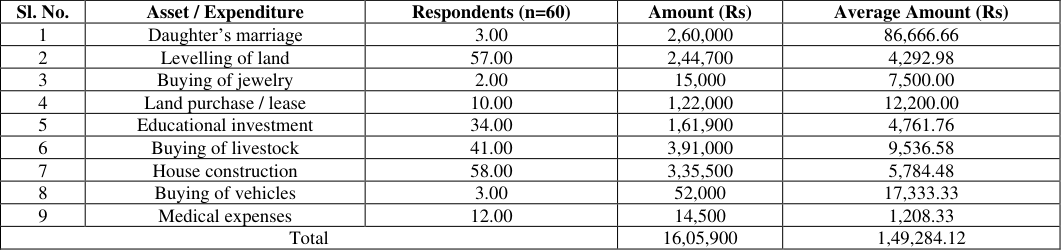 Table 21
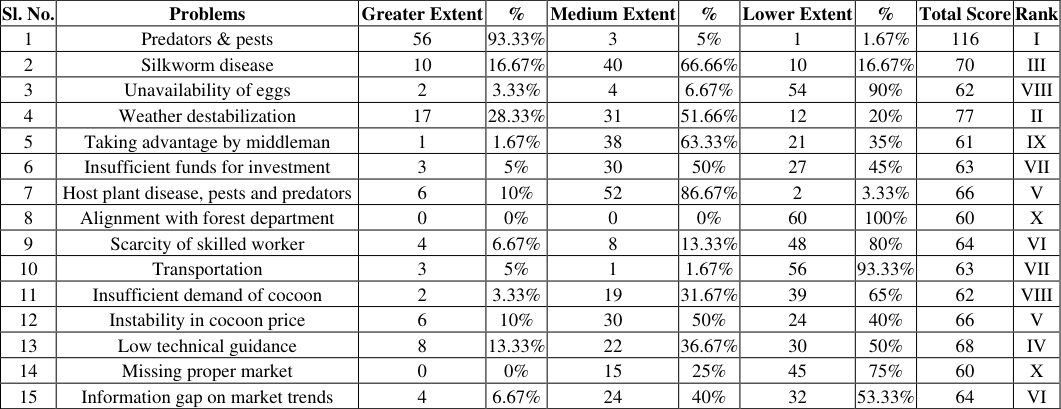 Table 22
Introduction
India ranks as the world's second largest silk-producing nation. Of the four silk types recorded in 2015-16, mulberry contributed 71.80 per cent (20,434 MT), tasar 9.90 per cent (2,818 MT), eri 17.80 per cent (5,054 MT) and muga 0.60 per cent (166 MT) of the country's total raw-silk output of 28,472 MT. India also holds the singular position of being the only country that turns out all five commercially recognised silks mulberry, tropical tasar, oak tasar, eri and muga. As a farm-anchored occupation that is labour-intensive yet commercially rewarding, sericulture sits within the cottage and small-scale segment of the economy. It is especially well matched to village-based cultivators, small entrepreneurs and artisans, since the capital outlay is modest while the scope for comparatively higher returns remains substantial. The activity channels both income and work to the rural poor, particularly to smallholders and to socially disadvantaged groups. Jharkhand possesses one of the country's strongest sericulture foundations. It leads the nation in tasar (a non-mulberry silk), accounting for a 76.40 per cent share of total output. In 2015-16 the state supplied 40.00 per cent of India's tasar silk, producing 2,284 metric tonnes of raw silk, and it contributes about 7.0 per cent of the country's overall silk production. Tasar silk from the state is shipped mainly to the United States, the United Kingdom, Germany, France, Turkey, Japan, Australia, Sweden and Switzerland. The state agency JHARCRAFT oversees the promotion of handicrafts and silk within Jharkhand. Being a forest-and agriculture-based industry, tasar production carries considerable promise for rural and tribal populations as a supplementary source of livelihood. The biological link between the host trees (the tasar food plants) and the feeder (the silkworm Antheraea mylitta Drury) forms a self-sustaining ecological unit that fits the economy and social fabric of rural communities, owing to its very low capital demand and high labour-absorbing capacity. Traditionally, tribal households have reared tasar worms in www.extensionjournal.com natural forests, chiefly once the monsoon recedes and the opportunity cost of family labour is at its lowest. On average a rearer devotes about 80 to 90 days a year to the work, and the whole family is drawn into the various operationsgathering seed cocoons, preparing layings, safeguarding the worms, and harvesting and marketing the cocoons. A combination of low investment, a short economic gestation period, favourable seasonal conditions and suitability for family labour keeps close to 60,000 households in the selected districts engaged in worm rearing. Tasar rearing is, however, far from risk-free. The worms are at the mercy of weather fluctuations, are readily attacked by pests and predators, and are prone to diseases that cause heavy mortality. Customary rearers are further held back by limited know-how and technology. Low productivity remains the foremost difficulty, aggravated by poor access to remunerative markets. As a result, many rearersthe youth in particularhave either scaled down their involvement or exited the sector altogether. Within Jharkhand, Saraikela-Kharsawan district returns the highest tasar cocoon output. Here tasar rearing has grown into a significant cottage industry and a mainstay of livelihood for the farming community. Against this background, the study was taken up with the following objectives:
• To examine the socio-economic profile of the farmers.
• To assess the improved tasar-culture practices adopted by the farmers. • To measure the contribution of tasar culture to farmers' livelihood. • To identify the constraints faced in running tasar culture as an enterprise.
Review of Literature 2.1 Socio-Economic Profile
Jagadisha (1999) [6] found that total land area, cosmopoliteness and extension participation bore a highly significant association with the knowledge of small farmers, whereas education and mass-media use were significantly linked to the knowledge level of large farmers. Shankar et al. (2000) [21] inferred that educational standing, cropping pattern, input access, mass-media use and extension contact together shaped the adoption level among sericulturists in Karnataka. Kher et al. (2004) [9] argued that farmers in the Jammu region ought to be sensitised, through mass media and other transfer channels, to employment-generating, sustainable and marketoriented technologies. Mallikarjuna et al. (2004) [11] recorded that sericulture farmers averaged 42 years of age, were largely literate (87 per cent), had a mean household size of seven, and belonged to joint families in 60 per cent of cases. Geetha and Geetha (2006) [4] observed that financial support from NGOs upgraded and modernised sericulture households while widening their contact with extension staff and their exposure to mass media. Meenal and Rajan (2007) [12] reported that most socioeconomic attributes significantly influenced adoption, the exceptions being age, education and family size, and that training exerted a positive and significant effect on cocoon output. Jayaram and Indumati (2010) [8] detected a significant relationship between knowledge level and education, total landholding, extension contact, social participation and cocoon yield. Rahmathulla et al. (2010) [19] concluded that trained sericulturists fared better than untrained ones in socioeconomic status, technology adoption, land-use patterns and income. Jayaprakash et al. (2011) [7] showed that education, family size and net income were significantly and positively associated with the knowledge and adoption of grainage technology in the private tasar grainages of Andhra Pradesh.
Level of Adoption of Technologies
Singhvi et al. (1994) [23] noted that 98.30 per cent of farmers reared worms inside dwelling houses and that the uptake of fertiliser application, plant protection and disease-control measures was low. Lakshmanan et al. (1998) [10] found that most respondents in Tamil Nadu neither applied essential inputs such as FYM and chemical fertiliser nor followed disease-control measures at the recommended levels.
Mohandas et al. (1999) [13] concluded that, despite a marked improvement in technology adoption, the gains were not fully mirrored in cocoon production, and that practices tied to young-age rearing chiefly distinguished high from low adopters. Qadri (2004) [18] recorded that the uptake of the latest sericulture technologies in Kerala ranged from low to medium.
Jayaram and Indumati (2010) [8] reported that several extension-related variables effectively separated respondents into low and high categories of sericulture technology adoption.
Contribution of Tasar Culture
Ghoshi (1949) [5] held that sericulture cannot prosper without support from state governments, and that its progress in any country is directly proportional to the backing it receives from the state. Patel (1976) [17] showed that sericulture can absorb farm labour at a very modest capital requirement, and that a hectare under mulberry can yield about four times the income obtainable from any alternative crop. Odyeyar (1978) [16] outlined the wide scope for developing sericulture in tribal belts, pointing to its large potential for lifting the per-capita income of tribal people and for fostering small-scale industrial entrepreneurship. Narain (1991) [15] reported that, through tasar culture, a household in Maharashtra could earn Rs. 2,000 to Rs. 4,000 over 40 to 50 days, thereby providing tribal families with productive work and supplementary income.
Problems Faced by Tasar Farmers
Reddy et al. (2010) [20] identified the leading constraints for sericulturists as the untimely availability of inputs (80 per cent), the high cost of fertilisers (68 per cent), inadequate finance (62 per cent), insufficient knowledge (60 per cent) and a shortage of labour (60 per cent). Deepa and Sujathamma (2007) [2] attributed the non-adoption of improved practices to a scarcity of economic resources, costly inputs, weak extension activity and poor rapport between farmers and extension workers. Munikrishnappa et al. (2002) [14] reported that swings in www.extensionjournal.com cocoon prices were among the principal reasons for the low or non-adoption of various recommended sericulture technologies.
Materials and Methods
The enquiry was carried out in Jharkhand, India. Saraikela-Kharsawan district was chosen purposively because it carries the largest area under tasar farming. The district lies between longitudes 85°30'14" E and 86°15'24" E and latitudes 22°29'26" N and 23°09'34" N. It spans 2,724.55 sq. km, of which 58,572.39 ha is forest and 1,244.92 ha is reserve forest.
Sampling Procedure
Selection of district: Saraikela-Kharsawan district of Jharkhand was selected purposively on account of its largest area under tasar culture.
Selection of blocks:
Of the district's nine blocks, two -Kuchai and Kharsawanwere picked at random. Selection of villages: Three villages were drawn at random from each of the two blocks, giving six villages in all. Selection of respondents: Ten tasar farmers were chosen randomly from every village, yielding a total sample of 60 cultivators.
Data Collection
A semi-structured interview schedule was designed to elicit primary information. Complementary participatory tools -focused group discussions (FGD), time lines and seasonal calendarswere also used. Secondary material was compiled from reports, journals, books, newspapers and relevant websites.
Independent variables: age, education, caste, landholding, host plant, primary occupation, training, improved practices, organisational membership and extension contact.
Dependent variables: livelihood, expressed through income and employment.
Statistical Tools
The information obtained from respondents was processed and interpreted with descriptive statistical measures, namely percentage, frequency, average and ranking.
Results and Discussion
Results and Discussion
Socio-Economic Characteristics of Respondents 4.1.1 Age Group
More than half of the respondents (53 per cent) were in the 20-39 year band, followed by the 40-59 year band (45 per cent), while only 2 per cent were above 60 years. Thus 98 per cent of the sample fell within the young and middle-aged groups, pointing to a relatively enterprising and businessminded population.
Gender
Male respondents outnumbered females -83.00 per cent against 17.00 per centindicating that men take the more active part in tasar cultivation.
Marital Status
An overwhelming majority (97 per cent) of respondents were married and only 3 per cent unmarried. Married individuals tend to be more driven to earn supplementary income for the welfare of their households.
Education
A third of the respondents (33.00 per cent) had studied up to middle school, followed by high school (22.00 per cent) and primary school (13.00 per cent). A sizeable share (22.00 per cent) was illiterate and a further 10.00 per cent could only read and write. Poverty and limited awareness have restrained educational attainment across the district.
Family Size
Small households of up to five members dominated (72.00 per cent), trailed by medium households of six to ten members (25.00 per cent) and large households of more than ten members (3.00 per cent). The pattern reflects a growing awareness of family planning.
Landholding
Cultivators with small holdings formed the largest group (75.00 per cent), followed by marginal (18.00 per cent), semimedium (5.00 per cent) and medium (2.00 per cent). No large farmer featured in the sample, confirming the dominance of small and marginal holdings in the study area.
Livestock Possession
Poultry was the most widely held livestock (96.66 per cent), followed by goat/sheep (90.00 per cent), ox (73.33 per cent), cow (50.00 per cent) and buffalo (6.66 per cent). Poultry and goatry brought respondents a steady stream of income; oxen served draught purposes, while cows and buffaloes were maintained for additional earnings and nutrition.
Sericultural Practices Adopted by Tasar Farmers 4.2.1 Cropping Practices
The proportion of farmers raising only the commercial crop (63.00 per cent) exceeded that of farmers raising both seed and commercial crops (37.00 per cent). Since the seed crop calls for a grainage house and greater technical competence, most cultivators leaned towards the commercial crop alone.
Area Under Tasar Culture
Just over half of the respondents (53.00 per cent) practised tasar cultivation on both their own land and forest tracts, while 32.00 per cent used forest land alone and 15.00 per cent worked exclusively on their own land. Because most cultivators are small and marginal with limited land, forest areas become indispensable, and the host plants (Arjun and Asan) were plentiful in the surrounding forests.
Contribution of Tasar Culture to Livelihood
In the study area, tasar culture proved to be a forest-and agriculture-based industry that offers considerable promise to tribal people as a livelihood base. Respondents drew on the host plants Arjun (Terminalia arjuna) and Asan (Terminalia tomentosa), both of which were abundant locally.
Skills Acquired
Cultivation-practice skills had been picked up by 88.33 per cent of respondents, followed by plant-protection skills (73.33 per cent), cocoon storage (25.00 per cent), microscopic testing of DFLs (15.00 per cent), reeling (6.66 per cent) and weaving (6.66 per cent). The central government, the state government and PRADAN were the leading contributors to this skill development.
Income Generation
From tasar culture, 73.00 per cent of respondents earned an average annual income of up to Rs. 25,000, 23.00 per cent earned Rs. 25,001-50,000, 2.00 per cent earned Rs. 50,001-75,000 and a further 2.00 per cent earned Rs. 75,001-1,00,000. The activity therefore delivers substantial income within a comparatively short window of two to three months.
Enhanced Living Standards
As Table 20 shows, every respondent reported better food consumption, while improvements were also recorded in housing (98.33 per cent), education (75.00 per cent), clothing (73.33 per cent) and access to transport (23.33 per cent) on account of tasar cultivation. The activity thus played a meaningful part in raising the quality of life of the cultivators.
| Sl. No. | Living Standard | Increased Status (n=60) | Percentage |
|---|---|---|---|
| 1 | Food | 60.00 | 100% |
| 2 | Accommodation | 59.00 | 98.33% |
| 3 | Obtain education | 45.00 | 75% |
| 4 | Apparels | 44.00 | 73.33% |
| 5 | Transportation | 14.00 | 23.33% |
Table text extracted from the original PDF; superscript letters are shown inline. The original table image is below.
View original table image
Assets Generated and Expenditure Of capital
Respondents most commonly channelled their tasar earnings into land levelling and the construction or repair of houses (26.00 per cent), followed by the purchase of livestock (19.00 per cent), spending on education (16.00 per cent), and the purchase or lease of land and medical expenses (5.00 per cent each). A small share (1.00 per cent) also went towards jewellery, vehicles and marriages.
Problems Encountered in Tasar Culture
Table 22 sets out the difficulties reported by the cultivators, the most pressing of which were pests and diseases affecting both the silkworm and the host plants. The farmers also contended with an array of other constraints, including weather destabilization, exploitation by middlemen, inadequate investment finance and unstable cocoon prices. A shortage of skilled workers and poor information on market trends were also significant, both taking the sixth rank. Poor market-trend information was experienced at medium and lower levels by 40.00 per cent and 53.33 per cent of respondents respectively, whereas the skilled-worker shortage was felt at lower, moderate and greater levels by 80.00 per cent, 13.33 per cent and 6.67 per cent respectively a consequence of tasar work being carried out largely by family labour that lacked the requisite skills. Inadequate investment finance ranked seventh; being mostly small and marginal, the farmers had little capital to commit, and 50.00 per cent and 45.00 per cent felt this constraint at medium and lower levels respectively. Difficulties in transporting cocoons were reported at a lower level by 93.33 per cent of respondents, and were not a major concern because the RMB and middlemen tended to buy cocoons directly from the farmers.
| Sl. No. | Problems | Greater Extent | % | Medium Extent | % | Lower Extent | % | Total Score | Rank |
|---|---|---|---|---|---|---|---|---|---|
| 1 | Predators & pests | 56 | 93.33% | 3 | 5% | 1 | 1.67% | 116 | I |
| 2 | Silkworm disease | 10 | 16.67% | 40 | 66.66% | 10 | 16.67% | 70 | III |
| 3 | Unavailability of eggs | 2 | 3.33% | 4 | 6.67% | 54 | 90% | 62 | VIII |
| 4 | Weather destabilization | 17 | 28.33% | 31 | 51.66% | 12 | 20% | 77 | II |
| 5 | Taking advantage by middleman | 1 | 1.67% | 38 | 63.33% | 21 | 35% | 61 | IX |
| 6 | Insufficient funds for investment | 3 | 5% | 30 | 50% | 27 | 45% | 63 | VII |
| 7 | Host plant disease, pests and predators | 6 | 10% | 52 | 86.67% | 2 | 3.33% | 66 | V |
| 8 | Alignment with forest department | 0 | 0% | 0 | 0% | 60 | 100% | 60 | X |
| 9 | Scarcity of skilled worker | 4 | 6.67% | 8 | 13.33% | 48 | 80% | 64 | VI |
| 10 | Transportation | 3 | 5% | 1 | 1.67% | 56 | 93.33% | 63 | VII |
| 11 | Insufficient demand of cocoon | 2 | 3.33% | 19 | 31.67% | 39 | 65% | 62 | VIII |
| 12 | Instability in cocoon price | 6 | 10% | 30 | 50% | 24 | 40% | 66 | V |
| 13 | Low technical guidance | 8 | 13.33% | 22 | 36.67% | 30 | 50% | 68 | IV |
| 14 | Missing proper market | 0 | 0% | 15 | 25% | 45 | 75% | 60 | X |
| 15 | Information gap on market trends | 4 | 6.67% | 24 | 40% | 32 | 53.33% | 64 | VI |
Table text extracted from the original PDF; superscript letters are shown inline. The original table image is below.
View original table image
The non-availability of eggs (DFLs) and the inadequate demand for cocoons both ranked eighth. Ninety per cent of respondents felt the DFL shortage only at a lower level, while inadequate cocoon demand was reported at medium and lower levels by 31.67 per cent and 65.00 per cent respectively. Farmers procured DFLs from PRADAN (an NGO) and the Kharsawan Pilot Project Centre, and the quality of these layings governed cocoon outputuntested or infected DFLs led directly to losses. Exploitation by middlemen ranked ninth, felt at medium and lower levels by 63.33 per cent and 35.00 per cent of respondents; because the RMB fixed the cocoon price, such exploitation remained limited, and farmers preferred to withhold their produce when middlemen offered less than the RMB rate. The absence of a proper market and difficulties in co-ordinating with the forest department jointly ranked tenth: the market problem was felt at lower and medium levels by 75.00 per cent and 25.00 per cent of respondents, while every respondent reported few difficulties in dealing with the forest department, since most practised tasar culture within natural forests.
Conclusion
• Tasar farming across the Kuchai and Kharsawan blocks offered the farming community a productive source of livelihood. • The bulk of respondents belonged to Scheduled Tribes, were young to middle-aged, and had schooling up to the middle-school stage. • The ready availability of host plants in the forest encouraged respondents to take up tasar culture on an extensive scale. • Not every recommended technology was adopted in full; however, rearing on economic plantations, pruning, protection against leaf gall and brushing through leaftwig transfer were taken up. • No respondent practised chawki rearing under nylon net, which left the crop open to pest attacks and depressed cocoon production. • Engagement in tasar cultivation markedly raised the skills, income and employment of the respondents. • The activity supplied more than half a year's worth of employment to respondents and helped curb inter-state migration. • The chief constraints were pest infestation, silkworm disease, food plant disease and climatic disturbance. • The additional income from tasar culture enabled respondents to secure food and nutrition, lift their standard of living and build new assets. • Beyond its role in rural livelihood, employment, income and the checking of out-migration, tasar culture also served the wider ends of ecological protection, heritage conservation and the preservation of socio-cultural values.
Suggestions
• Farmers should be familiarised with improved tasar technologies and market-driven practices through mass media and ICT tools. • Producer groups should be organised to enable collective production and marketing. • A timely and adequate supply of DFLs to rearers should be assured. • Respondents raising only the commercial crop should be encouraged to add the seed crop as well, so as to trim costs and lift profits. • Compensation provisions should be put in place for disease outbreaks and natural calamities. • Cocoon-purchase centres should be set up at the block level so that farmers receive fair prices close to home. • Reeling and weaving units should be established within the tasar-producing pockets of Jharkhand. • Special care should be taken to conserve the various tasar eco-races. • Adequate infrastructure, including storage and
Acknowledgement
www.extensionjournal.com marketing facilities, should be developed.• Planned efforts should be directed at building up the tasar industry and opening fresh avenues of income generation. • Research and development should be pursued under the Tribal Sub-Plan.
Figures and tables from the paper
| Sl. No. | Age Group (Years) | No. of Respondents (n=60) | Percentage |
|---|---|---|---|
| 1 | 20–39 years | 32.00 | 53% |
| 2 | 40–59 years | 27.00 | 45% |
| 3 | 60 & above | 1.00 | 2% |
Table text extracted from the original PDF; superscript letters are shown inline. The original table image is below.
View original table image
| Sl. No. | Caste | No. of Respondents (n=60) | Percentage |
|---|---|---|---|
| 1 | Scheduled Castes | 7.00 | 12% |
| 2 | Scheduled Tribes | 53.00 | 88% |
Table text extracted from the original PDF; superscript letters are shown inline. The original table image is below.
View original table image
| Sl. No. | Gender | No. of Respondents (n=60) | Percentage |
|---|---|---|---|
| 1 | Male | 50.00 | 83% |
| 2 | Female | 10.00 | 17% |
Table text extracted from the original PDF; superscript letters are shown inline. The original table image is below.
View original table image
| Sl. No. | Education | No. of Respondents (n=60) | Percentage |
|---|---|---|---|
| 1 | Illiterate | 13.00 | 22% |
| 2 | Can read and write | 6.00 | 10% |
| 3 | Primary school | 8.00 | 13% |
| 4 | Middle school | 20.00 | 33% |
| 5 | High school | 13.00 | 22% |
Table text extracted from the original PDF; superscript letters are shown inline. The original table image is below.
View original table image
| Sl. No. | Marital Status | No. of Respondents (n=60) | Percentage |
|---|---|---|---|
| 1 | Married | 58.00 | 97% |
| 2 | Unmarried | 2.00 | 3% |
Table text extracted from the original PDF; superscript letters are shown inline. The original table image is below.
View original table image
| Sl. No. | Family Type | No. of Respondents (n = 60) | Percentage |
|---|---|---|---|
| 1 | Nuclear | 44.00 | 73% |
| 2 | Joint | 16.00 | 27% |
Table text extracted from the original PDF; superscript letters are shown inline. The original table image is below.
View original table image
| Sl. No. | Livestock | No. of Respondents (n=60) | Percentage |
|---|---|---|---|
| 1 | Poultry | 58.00 | 96.66% |
| 2 | Goat / Sheep | 54.00 | 90.00% |
| 3 | Ox | 44.00 | 73.33% |
| 4 | Cow | 30.00 | 50.00% |
| 5 | Buffalo | 4.00 | 6.66% |
Table text extracted from the original PDF; superscript letters are shown inline. The original table image is below.
View original table image
| Sl. No. | Family Size | No. of Respondents (n=60) | Percentage |
|---|---|---|---|
| 1 | 1 to 5 | 43.00 | 72% |
| 2 | 6 to 10 | 15.00 | 25% |
| 3 | >10 | 2.00 | 3% |
Table text extracted from the original PDF; superscript letters are shown inline. The original table image is below.
View original table image
| Sl. No. | Occupation | Respondents (n=60) | Total Income (Rs) | Av. Income (Rs) | % Share |
|---|---|---|---|---|---|
| 1 | Tasar practice | 60.00 | 14,26,300 | 23,771.66 | 40% |
| 2 | Farming | 60.00 | 11,27,500 | 18,791.66 | 31% |
| 3 | NTFP | 58.00 | 4,32,500 | 7,456.89 | 12% |
| 4 | Labour | 31.00 | 3,77,000 | 12,161.30 | 11% |
| 5 | Business | 1.00 | 1,50,000 | 1,50,000 | 4% |
| 6 | Animal husbandry | 22.00 | 74,500 | 3,386.36 | 2% |
| Total | 35,87,800 | 2,15,567.87 | 100% |
Table text extracted from the original PDF; superscript letters are shown inline. The original table image is below.
View original table image
| Sl. No. | Landholding | No. of Respondents (n=60) | Percentage |
|---|---|---|---|
| 1 | Marginal | 11.00 | 18% |
| 2 | Small | 45.00 | 75% |
| 3 | Semi-medium | 3.00 | 5% |
| 4 | Medium | 1.00 | 2% |
Table text extracted from the original PDF; superscript letters are shown inline. The original table image is below.
View original table image
| Sl. No. | Crop | No. of Respondents (n=60) | Percentage |
|---|---|---|---|
| 1 | Only commercial crop | 38.00 | 63% |
| 2 | Seed crop + commercial crop | 22.00 | 37% |
Table text extracted from the original PDF; superscript letters are shown inline. The original table image is below.
View original table image
| Sl. No. | Source | No. of Respondents (n=60) | Percentage |
|---|---|---|---|
| 1 | Pilot Project Centre (PPC) | 25.00 | 42% |
| 2 | PRADAN | 28.00 | 47% |
| 3 | PPC + Self | 5.00 | 8% |
| 4 | PRADAN + Self | 2.00 | 3% |
Table text extracted from the original PDF; superscript letters are shown inline. The original table image is below.
View original table image
| Sl. No. | Area | No. of Respondents (n=60) | Percentage |
|---|---|---|---|
| 1 | Own land | 9.00 | 15% |
| 2 | Forest | 19.00 | 32% |
| 3 | Both (own land + forest) | 32.00 | 53% |
Table text extracted from the original PDF; superscript letters are shown inline. The original table image is below.
View original table image
| Sl. No. | Source | No. of Respondents (N=60) |
|---|---|---|
| 1 | State Government | 30.00 |
| 2 | NGOs | 30.00 |
Table text extracted from the original PDF; superscript letters are shown inline. The original table image is below.
View original table image
| Sl. No. | No. of Trees | No. of Respondents (n=60) | Percentage |
|---|---|---|---|
| 1 | Up to 50 | 3.00 | 5% |
| 2 | 51 - 100 | 25.00 | 42% |
| 3 | 101 - 200 | 30.00 | 50% |
| 4 | 201 and above | 2.00 | 3% |
Table text extracted from the original PDF; superscript letters are shown inline. The original table image is below.
View original table image
| Sl. No. | Technology | Adopted (n=60) | % | Not Adopted (n=60) | % |
|---|---|---|---|---|---|
| 1 | Rearing on economic plantation | 60.00 | 100% | 0.00 | 0% |
| 2 | Advanced nursery technique | 0.00 | 0% | 60.00 | 100% |
| 3 | Incorporation of organic manure | 25.00 | 41.66% | 35.00 | 58.34% |
| 4 | Chemical fertilizer applications | 9.00 | 15% | 51.00 | 85% |
| 5 | Pruning | 54.00 | 90% | 6.00 | 10% |
| 6 | Inter-cultivation operations | 54.00 | 90% | 6.00 | 10% |
| 7 | Leaf gall prevention | 60.00 | 100% | 0.00 | 0% |
| 8 | Protected chawki rearing under nylon net | 0.00 | 0% | 60.00 | 100% |
| 9 | Brushing with leaf cup | 0.00 | 0% | 60.00 | 100% |
| 10 | Brushing through leaf-twig for transfer | 60.00 | 100% | 0.00 | 0% |
| 11 | Sodium hypochlorite spray | 60.00 | 100% | 0.00 | 0% |
| 12 | Elimination of diseased worm (collect & bury) | 60.00 | 100% | 0.00 | 0% |
| 13 | Shifting of worm by individual picking | 22.00 | 36.66% | 38.00 | 63.34% |
| 14 | Shifting of worm by branch cutting | 60.00 | 100% | 0.00 | 0% |
| 15 | Maintenance during moulting | 30.00 | 50% | 30.00 | 50% |
| 16 | Hygienic condition – bleaching powder/lime | 60.00 | 100% | 0.00 | 0% |
| 17 | Hygienic condition – other chemicals | 40.00 | 66.66% | 20.00 | 33.34% |
| 18 | Sticky trap utilization | 0.00 | 0% | 60.00 | 100% |
| 19 | Categorizing of cocoon | 25.00 | 41.66% | 35.00 | 58.34% |
| 20 | Tracking during crop period | 60.00 | 100% | 0.00 | 0% |
Table text extracted from the original PDF; superscript letters are shown inline. The original table image is below.
View original table image
| Sl. No. | Skills | No. of Respondents (n=60) | Percentage |
|---|---|---|---|
| 1 | Cultivation-practice | 53.00 | 88.33% |
| 2 | Protection of plant | 44.00 | 73.33% |
| 3 | Storage of cocoon | 15.00 | 25.00% |
| 4 | Microscopic testing of DFLs | 9.00 | 15.00% |
| 5 | Reeling | 4.00 | 6.66% |
| 6 | Weaving | 4.00 | 6.66% |
Table text extracted from the original PDF; superscript letters are shown inline. The original table image is below.
View original table image
| Sl. No. | Mandays | No. of Respondents (n=60) | Percentage |
|---|---|---|---|
| 1 | 50 to 75 days | 16.00 | 27% |
| 2 | 76 to 100 days | 24.00 | 40% |
| 3 | 101 to 125 days | 20.00 | 33% |
Table text extracted from the original PDF; superscript letters are shown inline. The original table image is below.
View original table image
| Sl. No. | Annual income (Rs.) | No. of Respondents (n=60) | Percentage |
|---|---|---|---|
| 1 | Up to 25,000 | 44.00 | 73% |
| 2 | 25,001 to 50,000 | 14.00 | 23% |
| 3 | 50,001 to 75,000 | 1.00 | 2% |
| 4 | 75,001 to 1,00,000 | 1.00 | 2% |
Table text extracted from the original PDF; superscript letters are shown inline. The original table image is below.
View original table image
| Sl. No. | Asset / Expenditure | Respondents (n=60) | Amount (Rs) | Average Amount (Rs) |
|---|---|---|---|---|
| 1 | Daughter’s marriage | 3.00 | 2,60,000 | 86,666.66 |
| 2 | Levelling of land | 57.00 | 2,44,700 | 4,292.98 |
| 3 | Buying of jewelry | 2.00 | 15,000 | 7,500.00 |
| 4 | Land purchase / lease | 10.00 | 1,22,000 | 12,200.00 |
| 5 | Educational investment | 34.00 | 1,61,900 | 4,761.76 |
| 6 | Buying of livestock | 41.00 | 3,91,000 | 9,536.58 |
| 7 | House construction | 58.00 | 3,35,500 | 5,784.48 |
| 8 | Buying of vehicles | 3.00 | 52,000 | 17,333.33 |
| 9 | Medical expenses | 12.00 | 14,500 | 1,208.33 |
| Total | 16,05,900 | 1,49,284.12 |
Table text extracted from the original PDF; superscript letters are shown inline. The original table image is below.
View original table image
References
25 in the original paper- Benchamin KV, Jolly MS. Employment and income generation in the rural areas through sericulture. Indian Silk. 1987;26(2):9-13.
- Deepa P, Sujathamma P. Information source and consultancy pattern of different sericultural technologies at field level. Indian Journal of Sericulture. 2007;46(1):86-88.
- Diwakar P, Yegneshwar V. Tasar culture and tribal development. Kurukshetra. 1986;34(4):20-26.
- Geetha GS, Geetha Devi RG. Influence of an NGO on socio-economic status of sericulture farmers. Indian Journal of Sericulture. 2006;45(2):166-168.
- Ghoshi CC. Silk production and weaving in India. New Delhi: Council of Scientific and Industrial Research; 1949.
- Jagadisha K. Constraints in adoption of improved rearing technology practices by different categories of farmers. Mysore: Central Sericultural Research and Training Institute; 1999.
- Jayaprakash P, et al. An empirical assessment on economics, knowledge and adoption level of technology in tasar private grainages of Andhra Pradesh. Indian Journal of Sericulture. 2011;50(1):16-21.
- Jayaram H, Indumati S. Awareness, attitude and adoption of technological practices in sericulture. Indian Journal of Sericulture. 2010;49(1):64-69.
- Kher SK, et al. Training needs of farmers in agriculture and allied activities in Jammu region. Journal of Research SKUAST-J. 2004;3(2):167-171.
- Lakshmanan S, et al. Studies on adoption of sericultural innovations at farmers level in Tamil Nadu. Indian Journal of Sericulture. 1998;37(1):44-47.
- Mallikarjuna B, et al. Studies on constraints in adoption of new technologies in mulberry cultivation and silkworm rearing. Indian Journal of Sericulture. 2004;43(2):216-218.
- Meenal R, Rajan RK. Impact of socio-economic characters of sericulturists on knowledge, adoption and cocoon production in Tamil Nadu. Indian Journal of Sericulture. 2007;46(1):49-51.
- Mohandas TP, et al. Adoption rate of validated sericulture technologies and its impact on cocoon productivity. In: Proceedings of the National Seminar on Tropical Sericulture; 1999. p. 140-142.
- Munikrishnappa HM, et al. Association of socioeconomic characters with knowledge and adoption of improved sericulture practices. Indian Journal of Sericulture. 2002;41(1):89-91.
- Narain R. Tasar culture: A trial in Maharashtra. Indian Silk. 1991;29(10):32-33.
- Odyeyar DH. Sericulture: Spinning wealth and tribals. Yojana. 1978;26(20):11.
- Patel AR. Sericulture: A labour intensive industry. Khadigramodyog. 1976;23(3):147-154.
- Qadri SMH. Study on the level of adoption and constraints for non-adoption of improved sericulture technologies. Indian Journal of Sericulture. 2004;43(1):83-87.
- Rahmathulla VK, et al. Socio-economic characteristics, income and investment pattern of trained and untrained sericulturists. Indian Journal of Sericulture. 2010;49(1):96-100.
- Reddy RM, et al. Breeding perspective for silk yield and quality in Indian tropical tasar silkworm. Ranchi: Breeding and Genetics Division, Central Tasar Research and Training Institute, Central Silk Board; 2010.
- Shankar K, et al. An analysis of factors discriminating technology use among sericulturists in Karnataka. Indian Journal of Sericulture. 2000;39(1):52-59.
- Sinha S. The development of Indian silk. New Delhi: Oxford and IBH Publishing Co. Pvt. Ltd.; 1990.
- Singhvi NR, et al. Knowledge level and adoption of new sericulture technology by farmers in Hunsur Taluk. Indian Journal of Sericulture. 1994;33(1):48-55.
- Srinivasa G, et al. Training programme in sericulture: Evaluation and impact on extension personnel and sericulturists. Indian Journal of Sericulture. 2007;46(1):26-31.
- Sujatha B, et al. A study on adoption of recommended mulberry cultivation practices. Indian Journal of Sericulture. 2006;45(2):142-148.