
Research article · 2017 · Full text
International Journal of Statistics and Applied MathematicsSignificance test based on Rayleigh distribution
Volume 2(2) · Pages 07–11
Research areasStatistical Distribution Estimation and ApplicationsProbabilistic and Robust Engineering DesignCyclone Separators and Fluid Dynamics
Abstract
Author-writtenThis paper deals with the Rayleigh distribution as a life time model. Moments of order statistics and an ordered sample are used to define a test statistic for the null hypothesis that the considered random variable has Rayleigh distribution. The percentiles of the test statistic are evaluated and the power of the test is computed. Comparison of Rayleigh distribution verses half-logistic distribution and gamma distribution with shape parameter 2 is presented.
Summary
Source-checkedPlain-language reading of the full paper, prepared with AI and checked against the text. Each point links to the authors' own words.
Why it matters
- The Rayleigh distribution is frequently used as an increasing failure rate model in reliability studies and life testing experiments. View evidence ↗
- The frequency curve of the Rayleigh distribution is visually similar to those of the half-logistic distribution and the gamma distribution with a shape parameter of 2. View evidence ↗
- Determining if half-logistic or gamma distributions are reasonable alternatives to the Rayleigh distribution allows researchers to use simpler existing inferential procedures. View evidence ↗
The question
- The study aims to develop a method to discriminate between the Rayleigh distribution and two alternatives: the half-logistic distribution and the gamma distribution with shape parameter 2. View evidence ↗
What they did
- The researchers set the Rayleigh distribution as the null population (P0) and the half-logistic and gamma (shape parameter 2) distributions as the alternative populations (P1). View evidence ↗
- Critical values for the T* statistic were determined using 10,000 Monte-Carlo simulation runs for sample sizes ranging from 5 to 25. View evidence ↗
What they found
- The proposed test demonstrated high power across all considered alternative distributions. View evidence ↗
- The test is more powerful at discriminating the half-logistic distribution than the gamma distribution with shape parameter 2. View evidence ↗
- For a sample size of 5, the test power for the half-logistic distribution ranges from 0.9665 to 0.9823 across different significance levels. View evidence ↗
What it means
- The authors conclude that the T* statistic effectively discriminates the Rayleigh distribution from the half-logistic and gamma distributions, though it is most effective against the half-logistic model. View evidence ↗
Visual summary
1 visualsIllustrations explain the paper; they do not show study data.
Hypothesis Testing Framework
AI-generated conceptual illustration (Mathematical probability distribution curves). It explains the idea and does not show study data.
View source evidence ↗Figures & tables
From the original paper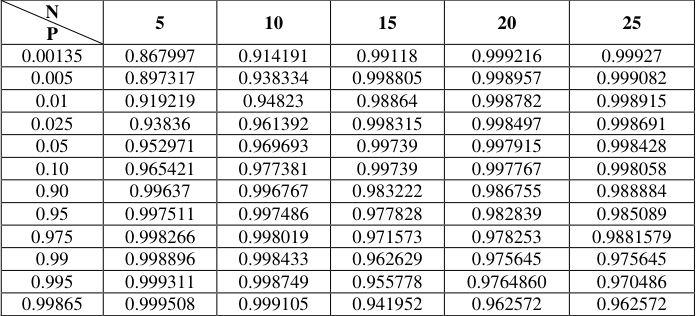 Table 3
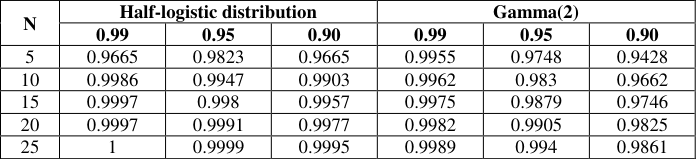 Table 3
 Table 4
 Table 4
Introduction
The well-known Weibull distribution is one of the most widely used probability distribution in Reliability engineering discipline and also is studied by many researchers with respect to various problems on statistical inference. Weibull distribution with shape parameter 2 is known as Rayleigh distribution. In the field of statistical research, life testing experiments and reliability studies Rayleigh is the one of the most commonly used increasing failure rate models, whose probability density function is given by
; 𝑥 ≥ 0 (1.1) = 0, 𝑜𝑡ℎ𝑒𝑟𝑤𝑖𝑠𝑒 where σ > 0, is the scale parameter of the distribution. The cumulative distribution function is given by
The Graphs of frequency curve of Rayleigh distribution
The graph of frequency curve of Rayleigh distribution look similar to half logistic distribution, gamma distribution with shape parameter 2 models. Incidentally Rayleigh distribution is a combination of half logistic distribution and gamma distribution with shape parameter 2. We present below the frequency curve of Rayleigh distribution that look similar to half logistic distribution, gamma distribution with shape parameter 2. In this paper we are interested to study the discrimination between Rayleigh distribution and half logistic distribution, gamma distribution with shape parameter 2. Another important of this study is to know whether half logistic distribution or gamma distribution with shape parameter 2 is a reasonable or better alternative to Rayleigh distribution in order to adopt the available simpler and admissible inferential procedures of half logistic distribution, gamma distribution with shape parameter 2 to Rayleigh distribution data. The similar studies of discrimination problems between probability models are made by Gupta et al. (2002) [6] , Gupta and Kundu (2003A) [7] , Gupta and Kundu (2003B) [8] , Gupta and Kundu (2004) [9] Kundu and Manglick (2004) [12] , Kundu et al (2005) [14] , Kundu and Manglick (2006) [11] , Kundu (2005) and (2007) [14,15] , Kundu and Ragab (2005) [14] , Arabin and Kundu (2009, 2010) [1,2] , Srinivasa Rao and Kantam (2011) [20] , Kantam et al (2015) [24] studied the significance test for the loglogostic distribution. Arabin and Kundu (2012A) [3] , Arabin and Kundu (2012) [3] , and the references there in. Sultan (2007) [22] developed a test criterion to distinguish generalized exponential distribution from weibull, normal distributions, and moments of order statistics in samples drawn from generalized exponential distribution. In this paper we adopt the criterion suggested by Sultan (2007) [22] to distinguish between Rayleigh and half-logistic, gamma distribution with shape parameter 2. A brief description of procedure developed by Sultan (2007) [22] and its applications to our model is presented in Section 3. The methodology of arriving at the critical values and powers of the test procedures are given in Section 4 respectively. In all this cases, the percentiles of respective test statistic and powers of test procedures for selected sample sizes evaluated numerically and are tabulated in the respective situations. Rayleigh distribution is considered as null population (P0) half-logistic distribution, gamma distribution with shape parameter 2 is considered as alternative populations (P1).
Test of Significance
Let us assume that the distribution of the life of the product is the scaled Rayleigh distribution where probability density function and cumulative distribution function given by. fx/σ(x) = As we mentioned in Section 1 that Rayleigh distribution is a combination of half-logistic distribution or gamma distribution with shape parameter 2. From this context we have considered Rayleigh distribution as null population and half-logistic distribution, gamma distribution with shape parameter 2 as alternative population. Sultan (2007) suggested a test statistic given by a formula
where x(i) is the order observation in the sample, α(i) is the expected value of i th standard order statistic in a sample of size n from the null population. If x1, x2,…, xn is a sample of size n from the null population the Equation (3.13) for T is used as a test statistic to discriminate a null population and the corresponding alternative population with the help of the critical values. Hence, the sampling distribution of T and its percentiles therefore are essential to make use of the test statistic T. Since, sample quantiles are consistent estimators of population quantiles. Hence we propose a statistic similar to T based on population quantiles rather than moments of order statistics and is given by
We have tabulated the percentiles of empirical sampling distribution of T * for n=5(5)25 through 10,000 Monte-Carlo simulation runs and are given in Table 3.1. The percentiles of T * would serve as critical values to test null hypothesis that a given sample comes from Rayleigh distribution and half logistic distribution, gamma distribution with shape parameter 2. Therefore a large value of T * implies a strong linear relation between x(i) and δ(i), which means that the sample is taken from Rayleigh distribution. On the other hand, a small value of T * indicates that the sample is from a distribution different from Rayleigh distribution. Hence the statistic T * is given by Equation (3.14) is approximate for testing the null hypothesis that X is distributed according to a Rayleigh distribution. The decision to reject the null hypothesis is based on the critical values of T with a pre-assigned level of significance. Accordingly, the percentiles of T * are essential to carry out the test procedure regarding the above hypothesis. For example, let tα denote the αpercentile of T * , then if
| N | Half-logistic distribution | — | — | Gamma(2) | — | — |
|---|---|---|---|---|---|---|
| 0.99 | 0.95 | 0.90 | 0.99 | 0.95 | 0.90 | |
| 5 | 0.9665 | 0.9823 | 0.9665 | 0.9955 | 0.9748 | 0.9428 |
| 10 | 0.9986 | 0.9947 | 0.9903 | 0.9962 | 0.983 | 0.9662 |
| 15 | 0.9997 | 0.998 | 0.9957 | 0.9975 | 0.9879 | 0.9746 |
| 20 | 0.9997 | 0.9991 | 0.9977 | 0.9982 | 0.9905 | 0.9825 |
| 25 | 1 | 0.9999 | 0.9995 | 0.9989 | 0.994 | 0.9861 |
Table text extracted from the original PDF; superscript letters are shown inline. The original table image is below.
View original table image
| N P | 5 | 10 | 15 | 20 | 25 |
|---|---|---|---|---|---|
| 0.00135 | 0.867997 | 0.914191 | 0.99118 | 0.999216 | 0.99927 |
| 0.005 | 0.897317 | 0.938334 | 0.998805 | 0.998957 | 0.999082 |
| 0.01 | 0.919219 | 0.94823 | 0.98864 | 0.998782 | 0.998915 |
| 0.025 | 0.93836 | 0.961392 | 0.998315 | 0.998497 | 0.998691 |
| 0.05 | 0.952971 | 0.969693 | 0.99739 | 0.997915 | 0.998428 |
| 0.10 | 0.965421 | 0.977381 | 0.99739 | 0.997767 | 0.998058 |
| 0.90 | 0.99637 | 0.996767 | 0.983222 | 0.986755 | 0.988884 |
| 0.95 | 0.997511 | 0.997486 | 0.977828 | 0.982839 | 0.985089 |
| 0.975 | 0.998266 | 0.998019 | 0.971573 | 0.978253 | 0.9881579 |
| 0.99 | 0.998896 | 0.998433 | 0.962629 | 0.975645 | 0.975645 |
| 0.995 | 0.999311 | 0.998749 | 0.955778 | 0.9764860 | 0.970486 |
| 0.99865 | 0.999508 | 0.999105 | 0.941952 | 0.962572 | 0.962572 |
Table text extracted from the original PDF; superscript letters are shown inline. The original table image is below.
View original table image
Holds, the null hypothesis cannot be rejected with level α. Thus, the percentiles of T * are essential, but unfortunately it is not possible to obtain the distribution of T * analytically. We determined the percentiles of T * by means of simulation on the basis of 10,000 simulation runs for various sample sizes. The obtained percentiles are given in Table 3.2.
Power of the test
The power of a test refers to the probability of not rejecting a wrong null hypothesis and this probability depends heavily on the assumed alternative distribution. Here in this case, the null hypothesis given by Rayleigh distribution as the alternative distribution we consider half-logistic distribution. The test statistic T * is calculated by generating a sample of a specified size from each of the alternative population with the 𝛿 (𝑖) in the formula for T * being those of Rayleigh distribution. The corresponding calculated value of T * is compared with the corresponding critical value given in Table 4.1. This process is repeated 10,000 times and the number of rejections of null hypothesis of the null hypothesis out of 10,000 times is taken as a measure of power of the test i.e.,
| S.No | Sample no | 99% | 95% | 90% |
|---|---|---|---|---|
| 1 | 5 | 0.0572 | 0.0252 | 0.0045 |
| 2 | 10 | 0.0338 | 0.0170 | 0.0038 |
| 3 | 15 | 0.0254 | 0.0121 | 0.0025 |
| 4 | 20 | 0.0175 | 0.0095 | 0.0018 |
| 5 | 25 | 0.0139 | 0.0060 | 0.0013 |
Table text extracted from the original PDF; superscript letters are shown inline. The original table image is below.
View original table image
| S.No | Sample no | 99% | 95% | 90% |
|---|---|---|---|---|
| 1 | 5 | 0.0335 | 0.0177 | 0.0020 |
| 2 | 10 | 0.0097 | 0.0053 | 0. 0014 |
| 3 | 15 | 0.0043 | 0.0020 | 0.0003 |
| 4 | 20 | 0.0003 | 0.0009 | 0.0003 |
| 5 | 25 | 0.0005 | 0.0001 | 0 |
Table text extracted from the original PDF; superscript letters are shown inline. The original table image is below.
View original table image
𝑝𝑜𝑤𝑒𝑟 𝑜𝑓 𝑡ℎ𝑒 𝑡𝑒𝑠𝑡 =
𝑛𝑢𝑚𝑏𝑒𝑟 𝑜𝑓 𝑟𝑒𝑗𝑒𝑐𝑡𝑖𝑜𝑛𝑠 𝑜𝑓 𝐻 0 10,000
The calculation of the power were performed for the above mentioned alternative with various sample sizes and various levels of significance for complete samples were presented in Tables 4.1 and 4.2 and the tables indicate the high power of the proposed test for all considered alternatives. The power indicates that the half logistic alternative is more powerful and gamma distribution with shape parameter 2 is less sensitive as alternative population. This shows that the test statistic clearly discriminates a Rayleigh distribution from half logistic distribution and gamma distribution with shape parameter 2 with decreasing power in that order.
References
19 in the original paper- Arabin K.D, Kundu D. Discriminating among the log-normal, weibull and generalized exponential distributions, IEEE Transactions on Reliability 2009; 58:416-424.
- Arabin K.D, Kundu D. Discriminating between the log-normal and log-logistic distributions, Communications in Statistics - Theory and Methods 2010; 39:280-292.
- Block H.W, Rao. A Beta warning-time distribution and a distended beta distribution, Sankhya B 1973; 35:79-84.
- Gupta R.D, Kundu D. Generalized exponential distributions: statistical inferences, Journal of Statistical Theory and Applications. 2002; 1:101-118.
- Gupta R.D, Kundu D. Discriminating between gamma and generalized exponential distributions, Journal of Statistical Computation and Simulation. 2004; 74:107-121.
- Kundu D, Gupta R.D, Manglick A. Discriminating between the log-normal and the generalized exponential distributions, Journal of the Statistical Planning and Inference. 2005; 127:213-227.
- Kundu D, Gupta R.D, Manglick A. A convenient way of generating normal random variables using generalized exponential distribution, Journal of Modern Applied Statistical Methods. 2006; 5:300-306.
- Kundu D, Manglick A. Discriminating between the weibull and log-normal distributions, Naval Research Logistics 2004; 51:893-905.
- Kundu D, Manglick A. Discriminating between the gamma and log-normal distributions, Journal of Applied Statistical Sciences 2005; 14:175-187.
- Kundu D, Raqab M.Z. Generalized Rayleigh Distribution: Different methods of estimation, Computational Statistics and Data Analysis 2005; 49:187-200.
- Kundu D, Raqab M.Z. Discriminating between the log-normal and generalized rayleigh distributions, Statistics 2007; 41:505515.
- Malik H.J. Exact distribution of the quotient of independent generalized gamma variables, Canadian Mathematical Bulletin 1967; 10:463-466.
- Ragab A, Green J. On order statistics from the log-logistic distribution and their properties, Communications in Statistics - Theory and Methods 1984; 13:2713-2724.
- Ragab A, Green J. Estimation of the parameters of the log-logistic distribution based on order statistics, American Journal of Mathematical and Management Science. 1987; 7:307-324
- Shah B.K, Dave P.H. A note on log-logistic distribution, Journal of the M.S. University of Baroda (Science Number) 1963; 12:21-22.
- Srinivasa Rao B, Kantam R.R.L. Significance test for half logistic distribution, Economic Quality Control 2011; 26:53-62.
- Sultan K.S. Order Statistics from the Generalised exponential distribution and pplications, Communications in Statistics - Theory and Methods 2007; 36:1409-1418.
- Tadikamalla P.R, Johnson N.L. Systems of frequency curves generated by the transformation of logistic variables, Biometrika 1982; 69:461-465.
- Kantam R.R.L, SriRam B, Suhasini. Significance test based on Log-logistic distribution, International Journal of computational and Theoretical statistics, ISSN (2210-1519) Int. J Comp Tho Stat No. 2, Nov, 2015)