
Research article · 2016 · Full text
International Journal of Statistics and Applied MathematicsThe optimum settings of culture conditions for optimum growth of kefir grains for nutrition and health using RSM with BBD
Volume 1(4) · Pages 24–33
Research areasAnimal Nutrition and PhysiologyAgricultural Systems and PracticesGenetic and phenotypic traits in livestock
Abstract
Author-writtenThis thesis provides the process used to optimize the growth of kefir grains for nutrition and health to yield the optimal size of the kefir grain. This combined process was successfully modeled and optimized by response surface methodology method with a Box–Behnken design. In this work, Box-Behnken Design of response surface methodology was used to optimize growth of kefir grains using fat content in milk, incubation time and the number of rotations using milk as culture liquid. The contour plots were generated to study the optimum yield and levels of culture conditions. The second-order model, was used to locate the optimum growth of kefir grains. Testing the prediction of the second order and its adequacy was verified using the I-optimality and G -optimality which was used to predict the growth of kefir gains at nearly all values of culture conditions. The statistical analysis was done using a two-way analysis of variance for fitting the data. The confidence level to check the growth of kefir grain were at 95%.Design expert was used to formulate the BBD design which yielded a class of three incomplete factorial designs which are useful for estimating the co-efficient in a second degree graduating polynomial. The optimal settings of the culture conditions were evaluated using stationery points to determine the possibilities of the response for the growth to optimal at stationery points levels. The data was analyzed using R statistical software and excel. Data was presented using tables and graphs.
Summary
Source-checkedPlain-language reading of the full paper, prepared with AI and checked against the text. Each point links to the authors' own words.
Why it matters
- Kefir grains are gelatinous yoghurt starters composed of a symbiotic mixture of yeasts, lactic acid bacteria, and some acetic acid bacteria. View evidence ↗
- Kefir grains provide probiotics and nutrients that may lower blood pressure and blood sugar, assist cancer patients during chemotherapy, and aid in detoxification. View evidence ↗
- Because of the diverse composition and properties of kefir probiotics, a universal processing protocol does not exist, requiring specific optimization for different growth sizes and culture compositions. View evidence ↗
The question
- The study aims to use Response Surface Methodology (RSM) with Box-Behnken Design (BBD) to optimize the growth of kefir grains to ensure they are healthy, nutritious, and contain high levels of probiotics. View evidence ↗
- The research specifically seeks to determine the optimal levels of milk fat content, number of rotations, and incubation time for maximum kefir grain growth. View evidence ↗
What they did
- The researchers used a Box-Behnken Design (BBD) within a response surface methodology to test the effects of milk fat content, incubation time, and number of rotations. View evidence ↗
- A second-order model was employed to locate optimum growth, with the model's adequacy verified through G-optimality and I-optimality criteria. View evidence ↗
- Data fitting was performed using a two-way analysis of variance (ANOVA) with a 95% confidence level. View evidence ↗
What they found
- Optimal growth exceeding 67.5 grams was observed when fat content was at a high level and incubation time was at a low level. View evidence ↗
- Growth greater than 67 grams was achieved when both milk fat content and rotation speed were set to high levels. View evidence ↗
- Growth exceeding 67.5 grams was also associated with a high number of rotations combined with a low incubation time. View evidence ↗
- The design's optimality was quantified with a G-optimal value of 11.25 and an I-optimal value of 25.94. View evidence ↗
- The I-optimality analysis yielded an efficiency of 61.1% for the growth of kefir grains using milk. View evidence ↗
What it means
- The authors conclude that kefir grain growth is maximized by using high milk fat content, a high number of rotations, and low incubation time. View evidence ↗
Visual summary
2 visualsIllustrations explain the paper; charts are replotted from the paper's own table values.
Optimal Growth Factors
AI-generated conceptual illustration (kefir grains in milk). It explains the idea and does not show study data.
View source evidence ↗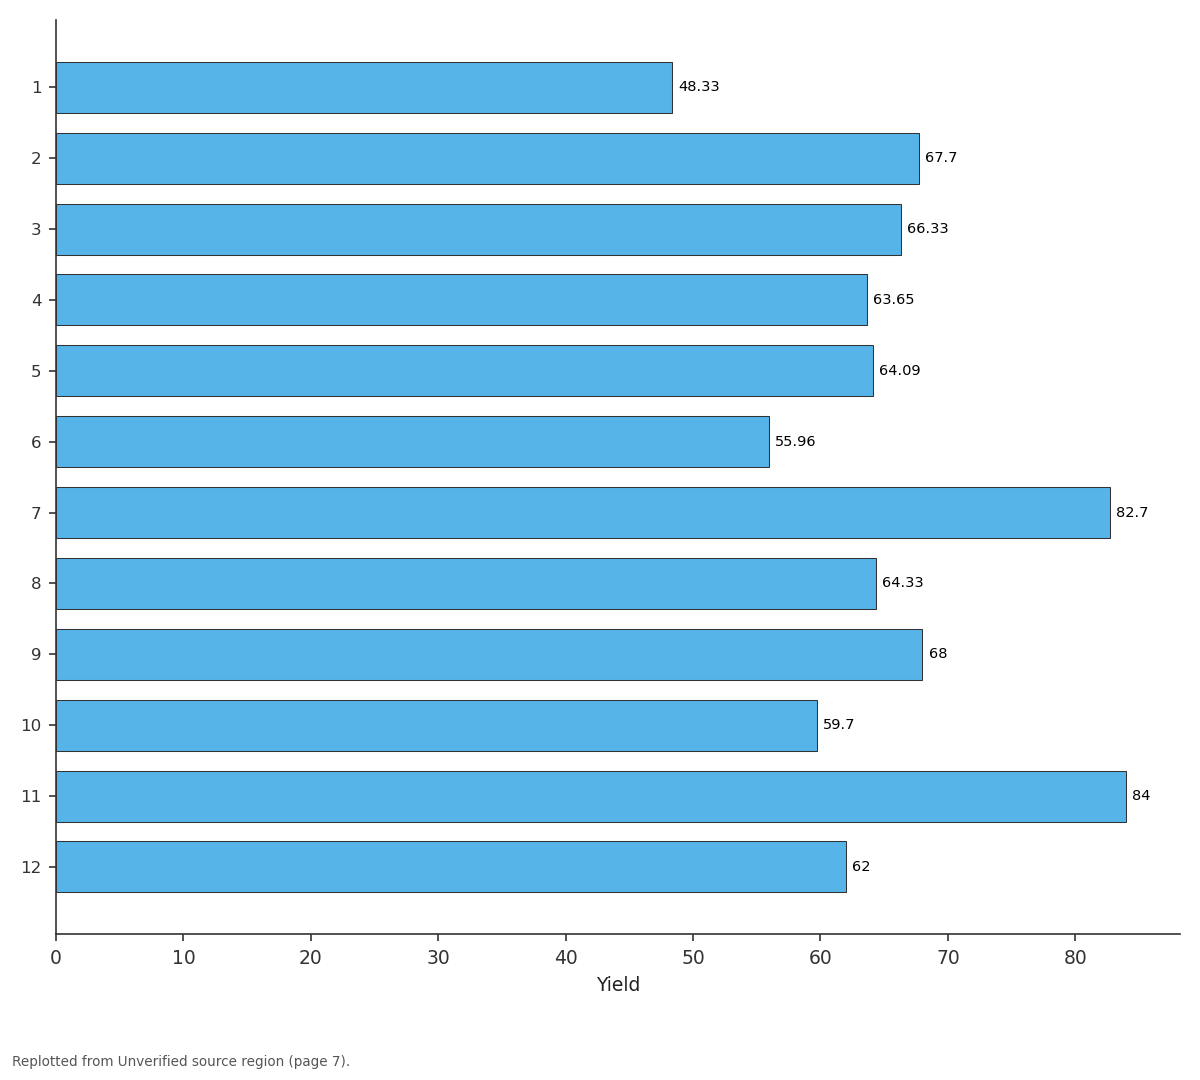
Yield: 1 vs 2 vs 3 vs 4 vs 5
Replotted from a table (page 7) of the original paper. Every bar is the paper's own table value.
View source evidence ↗Figures & tables
From the original paper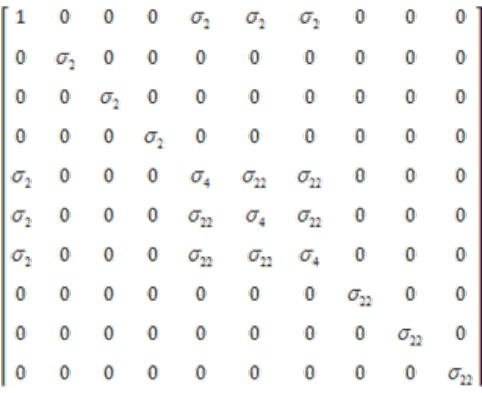 Figure 1
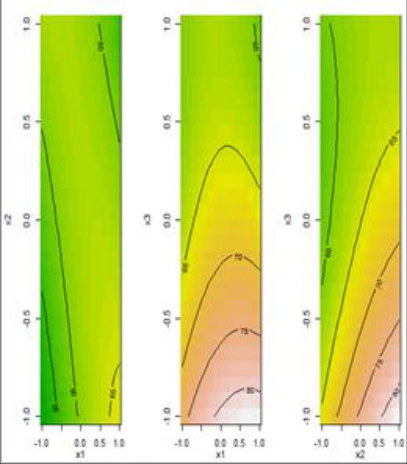 Figure 2
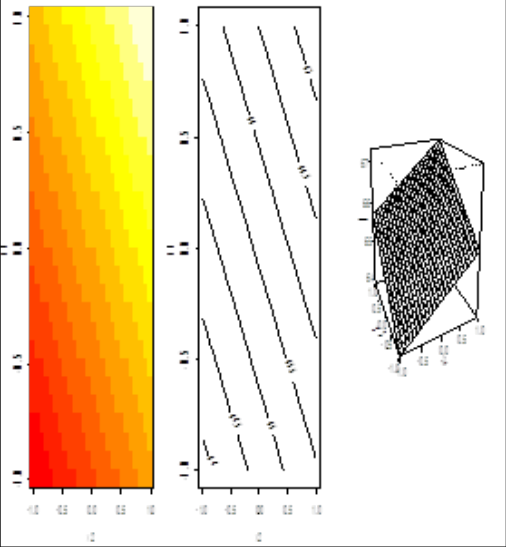 Figure 3
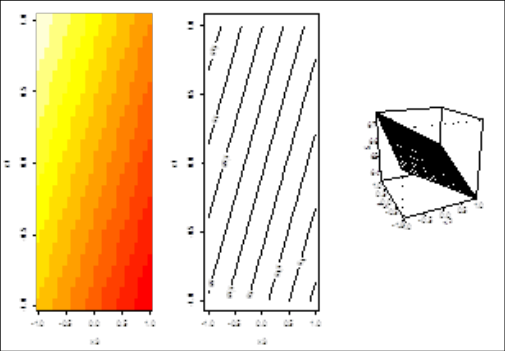 Figure 4
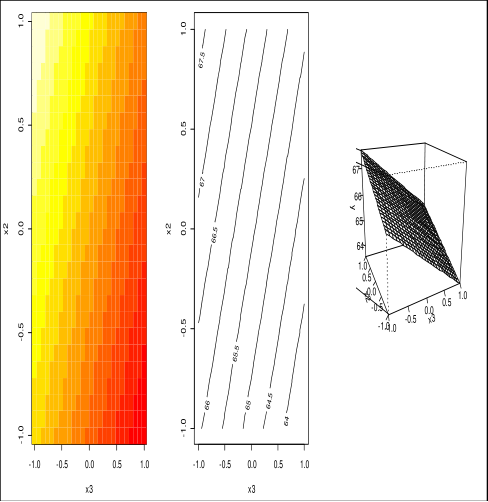 Figure 5
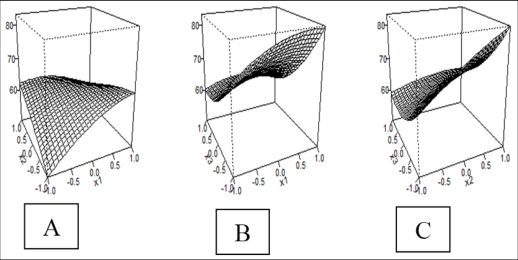 Figure 6
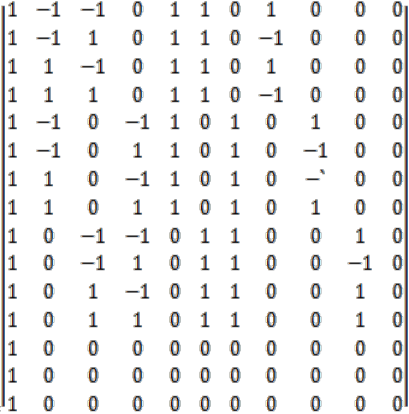 Figure 7
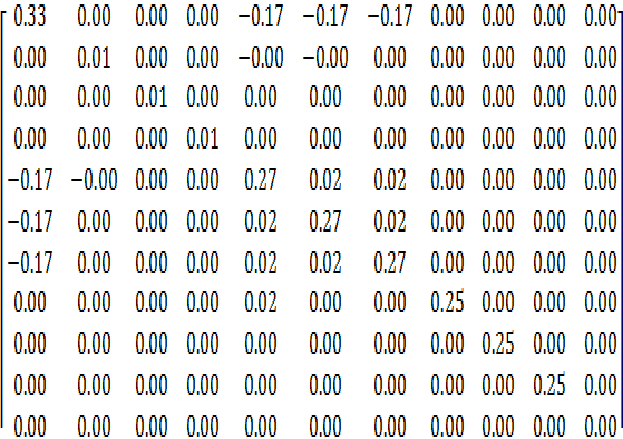 Figure 8
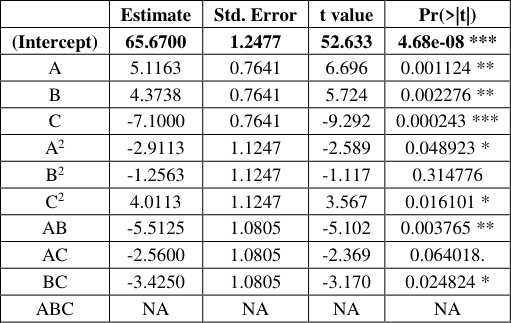 Table 1
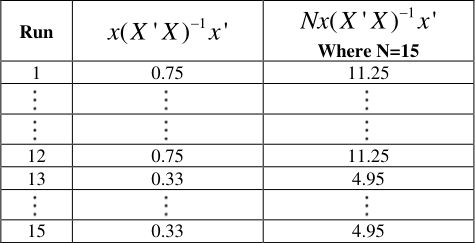 Table 3
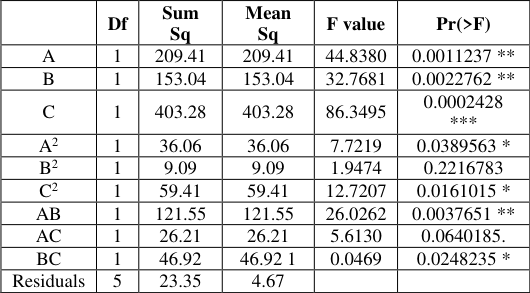 Table 2
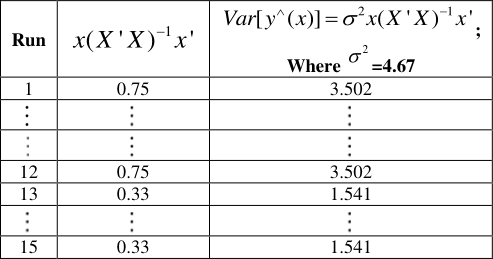 Table 2
 Figure 9
 Figure 10
Introduction 1.1 Background of the study
Kefir grains are a kind of yoghurt starter which are white to yellow-white, gelatinous and variable in size and consist of a complex microbial symbiotic mixture of lactic acid bacteria, yeasts and few acetic acid bacteria which stick to a complex-protein matrix and carbohydrates [6] These benefits of Kefir grains contain probiotics.it is a fantastic source of other nutrients, it lowers blood pressure, lowers blood sugar, good for cancer patients especially when going through chemotherapy, it can help people with allergies, helps the detoxification process by binding to some mutagens, agents that can literally change your DNA, they are wonderful for digestion, it is a whole food for nutrients and health, Its better than yoghurt since kefir usually contains about 30 strains of bacteria, whereas yoghurt products usually only contain about 10. It can help prevent side effects and damage done by antibiotics; it may help with lactose intolerance [5] To optimize growth, higher degree polynomial such as second-order model is used and this leads to the approximating function with squared variables and its interaction.In factorial experiments, different levels of multiple factors are investigated simultaneously and one factor can be examined at different levels of the other factor or factors [12] .
Problem Statement of the study
Presently, there are many research articles about optimization methods; the typical ones are based on calculus, numerical methods, and random methods. The calculus based methods have been intensely studied and are subdivided in two main classes: 1) the direct search methods that find a local maximum moving on a function over the relative local gradient directions and 2) the indirect methods that usually find the local ends by solving a set of non-linear equations, resultant of equaling the gradient from the object function to zero, i.e., by means of multidimensional generalization of the notion of the function's extreme points from elementary calculus give a smooth function without restrictions to find a possible maximum which is to be restricted to those points whose slope is zero in all directions. Considering the diversity in composition of the natural biomass in kefir grain production, as well as the structure and physicochemical properties of these probiotics, a universal processing protocol is not conceivable, and specific processes must be designed and optimized for each growth size depending on different factors and the culture composition used [10] . For such programmes to be effective, it is essential that the models are accurate. Once process variability from these sources is identified and optimized, an accurate extraction process model can be derived. Available optimization tools make it possible to optimize the production process design variables and the one of the best tool is the response surface methodology (RSM). Thus the main problem make the growth of kefir grains that yields grains that contain high level of probiotics using RSM with BBD techniques with high level of probiotics that are healthy and nutritious.
Purpose of the study
The study was carried out to understand the optimum setting of fat content, number of rotation and time that will yield optimum growth of kefir grains using milk. It also involved modeling and optimizing the level of the controllable independent variable.
Literature Review
The first goal for Response Surface Method is to find the optimum response. When there is more than one response then it is important to find the compromise optimum that does not optimize only one response [16] . This design was developed by Box and Behnken [7] it provides three levels for each factor and consists of a particular subset of the factorial combinations from the 3 k factorial design. The actual construction of such a design is described in the three RSM books [4] . For this study fitting a second-order model was done using the Box-Behnken design (BBD) which is a response surface methodology (RSM) design that requires only three levels to run an experiment. It is a special 3-level design because it does not contain any points at the vertices of the experiment region. This could be advantageous when the points on the corners of the cube represent level combinations that are prohibitively expensive or impossible to test because of physical process constraints [9] . To attain this [2] , defined a variance function, i.e., the scaled prediction variance. The SPV provides a measure of the precision of the estimated response at any point in the design space is optimal using Goptimal criteria. G-optimality protects the experimenter against the worst case scenario being too undesirable. An interesting and an important result is that the lower bound for the maximum SPV is equal to p, the number of parameters in the model [13] . The G-and I-criteria are prediction oriented criteria, so they are used for second-order models, as secondorder models are often used for Optimization and good prediction properties are essential for optimization [12] . Ioptimality seeks designs that minimize the average variance of prediction over the experimental region by integrating the variance surface 1 '
x M x . [17] argue in favor of I optimality that the attempt of determining I-optimality is to generate a single measure of prediction performance through an averaging process; that is, () x is averaged over some region of interest .The rotatability of the design was determined to check the variance of the predicted response at any point is a function of the distance from the central point alone [11] . A second -order response surface design is slope rotatable if the variance of the estimate of the first derivative yu xi , is only a function of the distance x x x from the origin(center) of the design [18]
Material and Methodology
Response surface methodology was used to optimize the growth of kefir grains using milk fat content, number of rotations and time since the response was influenced by different parameters [16] . The optimization entailed the basic strategies involved use of four steps [7] .
Second-order model
For this study fitting a second-order model was done using the Box-Behnken design (BBD). The second order model used to approximate the response was expressed as
The stationary points in the design [2] were located by expressing the model in matrix notation,
To find stationery points, partial derivatives were taken as follows
And the predicted maximum response was given by 0 1 2
Optimizing was done by considering the second -degree model in written in matrix for as
( , ,........ ) ', *=( , ,.... ) '
and B is a symmetric matrix of order k × k whose i th, diagonal element is βii (i = 1, 2... k), and its (i, j) th off-diagonal element is 1 ( , 1, 2,..., ; i j)
And the method of Lagrange multipliers was used to search for the optimum considering the function
Differentiating H w.r.t x, we have
Solving for X, we obtain (11) Therefore, to achieve a maximum, we applied [9] concept who suggested that λ be chosen larger than the largest eigenvalue of . Such a choice causes ˆn I to be negative definite.
Choosing λ smaller than the smallest eigenvalue of causes ˆn I to be positive definite, which results in a minimum. To test the prediction of the second model through the region of interest was done by testing the ratatability of the model to provide good predictions throughout the region of interest. At some point x, the variance is given by the formula,
To measure the degree of rotatability for a given response surface design.We determine the scaled predictive probability as
is said to be rotatable if the prediction variance in [13] is constant at all points that are equidistant from the design center, this, by a proper coding of the control variables, can be chosen to be the point at the origin of the k-dimensional coordinates [8] .
Optimal -Criterion
The design prediction criteria of response surface experiment for this model was determined by using G-optimality criterion and I-optimality criterion. G-optimality seeks to minimize the maximum entry in the diagonal of the hat matrix X'(X'X) -1 X. The design is G-optimal if it minimizes the maximum scaled prediction variance over the design region i.e. is the maximum value of G-optimality was determined by
Over the design region is a minimum, where N is the number of points in the design. Then efficiency of the design was determined by
Where Ge is the G-efficiency. Assume that we wish to construct a design for fitting a full quadratic polynomial response surface on a k-dimensional design space ( )
Where R is the design space and
The I-optimal design to determine the I -optimal criteria efficiency was then defined by moment matrix M as shown below (Giovannitti-Jensen and Myers, 1989); M=
r is the radius of a ball or sphere [15] . Hence it seeks to minimize the average prediction variance over the design space [1] which leads to a nice efficiency for the design which is given by;
Results
Determination of the optimum levels of milk fat content, number of rotations and time that lead to optimum growth of kefir grains Since there was presence of significant lack of fit for the first order model for main and interaction effects, hence there was a curvature in the response surface which makes the first-order model to be insufficient especially when all the factors interactions. A second-order model was developed to help in approximating a portion of the true response surface with parabolic curvature or quadratic effects. This model was designed using BBD and The data in appendix 1 used to fit the second order model for optimization of kefir grains using milk From appendix II, the second order equation model was fitted as follows Yyield=65.670+5.116A+4.374B-7.100C-2.911A 2 -1.256B 2 +4.011C 2 -5.513AB-2.560AC-3.425BC From appendix II all other parameters are significant at p-value<.05 except B 2 , AC and ABC which had non-significant influence on the growth of kefir grains. Thus the refined best model to predict growth of kefir grains using second order model was determined as follows; Yyield=65.670 +5.116A+4.374B-7.100C-2.911A 2 +4.011C 2 -5.513AB-3.425BC The respective a nova table of the second order model was displayed as shown in Appendix III, From a nova table, coefficients of all the factors were significant factor at p-value<.05, except the coefficient of B(speed of rotations) in the quadratic component and the interaction of AC for the growth of kefir grain, this results to the equation below that is best suit for fitting second order model. Thus fitting values of factors A, B, and C in using coded values, the optimum yield of kefir grains using milk was predicted as follows Yyield=65.670+5.116(1)+4.374(1)-7.100(-1)-2.911(1)+4.011(-1) 2 -5.513(1)(1)-3.425(1)(-1) =80.602 grams The R 2 and adjusted R 2 were very high(>.9) and close to 1 hence it indicated that equation (4.20) is a good model to estimate the optimum growth of kefir grains using second order model. The R 2 and adjusted R 2 were also significant at a p-value<.05.
Contours of relationship of factors for growth of kefir grains using milk
The contours plots for lines and area were drawn to explain the relationship between the culture conditions and the response as shown in the figure below. From figure 3, the relationship of fat content and speed of rotations indicates an optimal growth for kefir grains which is > 67 grams. This occurs at high levels (1) of the variables. It also indicates that increases in growth of kefir grains will increases with increase in both fat content in milk and speed of rotation of solution for the growth of kefir grains. From figure 4, the relationship of fat content and time indicates an optimal growth for kefir grains which is > 67.5 grams. This occurs at high level (1) of the fat content and low level (-1) of time. It also indicates that increases in growth of kefir grains will increases with increase in fat content in milk and decrease in incubation time when growing kefir grains. From figure 5, the relationship of fat content and time indicates an optimal growth for kefir grains which is > 67.5 grams. This occurs at high level (1) of the number of rotations and low level (-1) of time. It also indicates that increases in growth of kefir grains will increases with increase speed of rotations and decrease in incubation time when growing kefir grains.
The 3D Surface plots for operating conditions of growing kefir grains using milk
They were useful for establishing the growth of kefir grains based on milk fat content, speed of rotations and time using milk as the culture liquid. The 3D surface plots provided a clearer concept of the response surface than contour plots. For this study they were displayed as follows
Analyzing the Stationary Point
The second-order model illustrates quadratic surfaces such as minimum, maximum, ridge and saddle such that if there exits an optimum then this point is a stationary point. When the surface is curved in one direction but is fairly constant in another direction, then this type of surface is ridge system. The stationary point for this design was found by using matrix algebra. Recall Yyield=65.670+5.116A+4.374B-7.100C-2.911A
Then stationary points were obtained using (3.35) s X
The stationary points were also found in terms of the natural variables for milk fat content, number of rotations and time as follows; 7 3.125 3.5 f ;f=17.938 which is a minimum point of reaction by using 18 grams of fat content in growing kefir grains using milk no change is expected on the growth within the levels of settings for time and speed of rotations. ; r=-166.95 which is a maximum point of reaction and it takes 167 rotations to grow kefir grains using milk and no change is expected on the growth within the levels of settings for milk fat content and time. This was a significant optimum growth of kefir grains at stationery points. Since and t f were positive hence minimum point and r was negative hence maximum, then the stationery points of this experiment resulted to a saddle point.
Application of Ridge analysis to optimize the design
Since the stationery points resulted to a saddle point, the ridge analysis for saddle point was applied to second-order model. This helped to maximize the response yield of kefir grain under stationary points. Recall Yyield=65.670+5.116A+4.374B-7.100C-2.
This leads to all diagonals (6.334, 9.644, 20.178)>0 which is minimum point.
But the Eigen values of determined by R program were 5.078,-0.273 and-4.962, indicating a minimum point which is positive and two maximum points which are all are negatives and this yields saddle point of operation. This indicates that a ridge analysis reveals reasonable operating conditions, with the implied constraints of growing kefir grains using milk. , this was achieved by a proper coding of the control variables, which were to be chosen at the origin of the k-dimensional coordinates of the design. This resulted to predictive variance which is the variance of the predicted response at points of interest. The variance of the stationery points was 1.541 as shown in the above table. Thus for all points that are equidistance from the design center the variance=4*0.75=3.502.This shows that the design is rotatable because the variance of the points that are equidistance from the design center is the same for all nonstationery runs. The scaling predictive variance (SPV) was computed to enable comparison of various design points. The SPV was used to provide a measure of the precision of the estimated response at any point in the design space and it was used to compare the design. It was obtained and the results were displayed in the table below Hence 89% efficiency which 90% was achieved and this means that the maximum SPV=11.25 for this design is not that much different from its optimum value. This makes the maximin G-optimal design cost effective and highly recommendable since it's more effective and hence reduces cost which involved in designing and growing kefir grains using milk by box-behnken design. I-optimality was also computed to minimize the normal average integrated prediction variance and M was determined as follows by Obtaining This yielded 61.1% of the efficiency in growing kefir grains using milk. This is a good efficiency on average and it suggests that there was uniformity in running experiments to grow kefir grains using milk. Thus the average differences in running the experiments for the box-behnken designed were minimized by 61.1% and hence more efficiency was realized in operations during the growing process.
Conclusion
The second order model was studied to determine the optimum growth of kefir grains which yielded an optimal growth of kefir during the process. The best results for predictive response were obtained at stationery points. Second-order model described quadratic surfaces, which represented minimum point using aridge analysis where all the stationery points were all positive and hence minimum point was achieved from this study.
Acknowledgement
I would like to thank Almighty God who gave me strength, good health, and wisdom during period of my research. Thanks to my supervisor, Professors Koske J.K and John Muindi Mutiso, whose tolerance and help has been invaluable.
Figures and tables from the paper
| — | Estimate | Std. Error | t value | Pr(>|t|) |
|---|---|---|---|---|
| (Intercept) | 65.6700 | 1.2477 | 52.633 | 4.68e-08 *** |
| A | 5.1163 | 0.7641 | 6.696 | 0.001124 ** |
| B | 4.3738 | 0.7641 | 5.724 | 0.002276 ** |
| C | -7.1000 | 0.7641 | -9.292 | 0.000243 *** |
| A2 | -2.9113 | 1.1247 | -2.589 | 0.048923 * |
| B2 | -1.2563 | 1.1247 | -1.117 | 0.314776 |
| C2 | 4.0113 | 1.1247 | 3.567 | 0.016101 * |
| AB | -5.5125 | 1.0805 | -5.102 | 0.003765 ** |
| AC | -2.5600 | 1.0805 | -2.369 | 0.064018. |
| BC | -3.4250 | 1.0805 | -3.170 | 0.024824 * |
| ABC | NA | NA | NA | NA |
Table text extracted from the original PDF; superscript letters are shown inline. The original table image is below.
View original table image
| — | Df | Sum Sq | Mean Sq | F value | Pr(>F) |
|---|---|---|---|---|---|
| A | 1 | 209.41 | 209.41 | 44.8380 | 0.0011237 ** |
| B | 1 | 153.04 | 153.04 | 32.7681 | 0.0022762 ** |
| C | 1 | 403.28 | 403.28 | 86.3495 | 0.0002428 *** |
| A2 | 1 | 36.06 | 36.06 | 7.7219 | 0.0389563 * |
| B2 | 1 | 9.09 | 9.09 | 1.9474 | 0.2216783 |
| C2 | 1 | 59.41 | 59.41 | 12.7207 | 0.0161015 * |
| AB | 1 | 121.55 | 121.55 | 26.0262 | 0.0037651 ** |
| AC | 1 | 26.21 | 26.21 | 5.6130 | 0.0640185. |
| BC | 1 | 46.92 | 46.92 1 | 0.0469 | 0.0248235 * |
| Residuals | 5 | 23.35 | 4.67 |
Table text extracted from the original PDF; superscript letters are shown inline. The original table image is below.
View original table image
References
18 in the original paper- Atkinson AC. Fast very robust methods for the detection of multiple multivariate data, Computational Statistics and Data Analysis. Oxford: Oxford University Press. 2007.
- Box GEP, Hunter WG, Hunter JS. Statistics for Experimenters: An Introduction toDesign, Data Analysis, and Model Building. 2nd edition. John Wiley & Sons, New York. 2005.
- Box, Leu. Multifactor experimental designs for exploring response surfaces. Ann MathStat. 1999, 1957, 28:195241.
- Box GEP, Draper NR. Response Surfaces, Mixtures, and Ridge Analyses. 2nd ed. Hoboken, New Jersey: John Wiley & Sons. 2007.
- Dominic N Anfiteatro. How to make kefir and Recipes Created, published, maintained and Copyrighted © by. All rights reserved. 2015.
- Farnworth ER. Kefir-A complex probiotic. Food Sci Technol. Bulletin: Functional Foods: 2000; 2(1)1-17. doi: 10.1616/1476-2137.13938
- Box GEP, Hunter JS. Multifactor experimental designs for exploring response surfaces, Annals of Mathematical Statistics. 2010; 28:195-241.
- Huda S, Al-Shingiti A. Rotatable generalized central composite designs: A -minimax efficiencies for estimating slopes. Pakistani Journal of Statistics. 2004; 20(3):397-407.
- Jun S, Irudayaraj J, Demirci A, Geiser D. "Pulsed UVlight treatment of corn meal for inactivation of Aspergillusniger spores, International Journal of Food Science and Technology. 2003; 38(8):883-888.
- Molina S, Moran-Valero MI, Martin D, Vázquez L, Vargas T, Torres CF. Antiproliferative effect of alkylglycerols as vehicles of butyric acid on colon cancer cells. ChemPhys Lipids. 2013; 175-176:50-56. doi: 10.1016/j.chemphyslip.
- Cavazzuti M. Optimization Methods: From Theory to Design, 2013, 13 DOI: 10.1007/978-3-642-31187-1_2, © Springer-Verlag Berlin Heidelberg
- Montgomery DC. Design and analysis of experiments, Wiley, Hoboken, NJ, 5th ed. 2009.
- Myers RH, Montgomery DC. Response Surface Methodology: Product and Process Optimization Using Designed Experiments. 2nd edition. John Wiley & Sons, New York. 2002.
- Nam-Ky Nguyena, John J Borkowskib. New 3-level response surface designs construc-ted from incomplete block designs, Journal of Statistical Planning and Inference. 2008, 294-305.
- Onukogu IB, Chigbu PE. (eds.) Super Convergent Line Series in Optimal Design of Experiments and Mathematical Programming. Nsukka: AP Express Publishers. 2002.
- Park SH, Kim HJ, Cho J. Optimal central composite designs for fitting Second order response surface regression models. Recent advances in Linear Models and Related Areas. Physica -Verlag HD, 2008, 323-339.
- Rodriguez M, Jones B, Borror CM, Montgomery DC. Generating and Assessing Exact G-Optimal Designs, Journal of Quality Technology, 2010; 42(1):329.
- Victorbabu, Ch Surekha VVS. a note on measure of rotatability for second order response surface designs using incomplete block designs. 2013.